Write Up for Models Predicting Sybil Scores of Wallets

Hello Modeloors,

Consider this thread as your home for sharing all things related to your submissions in the Octant Sybil analysis challenge where you need to predict sybil scores of wallets.

Your write-up here is required for being eligible to receive a prize

We encourage you to be visual in your submissions to show weights given to the models, share your juypter notebooks or code used in the submissions, other datasets that are useful for other participants and any other information you deem valuable to participants

Since write-ups can be made after submissions close, other participants cannot copy your methodology in the round. You can take cues for writeups here from another competition we held, along with ideas for creating your own model.

The format of submissions is open ended and free for you to express yourself the way you like. You can share as much or as little as you like, but you need to write something here to be considered for prizes.

Good luck predictoooors

5 Likes

Sybil Detection Model Writeup: Crypto Pond Competition (Highly Detailed Analysis)

Participant: Rhythm Suthar

Email : rhythmsuthar123@gmail.com

Contact : +91 7046830999

Date: April 19, 2025

1. Introduction

1.1. Problem Statement & Motivation

Sybil attacks represent a persistent and significant threat within decentralized Web3 ecosystems. These attacks involve a single adversary creating and controlling numerous fake identities (wallets) to illegitimately amplify their influence, exploit incentive mechanisms, or disrupt system operations. The consequences are far-reaching, undermining the fairness of token distributions (airdrops), compromising the integrity of decentralized governance votes, distorting grant funding allocations, and potentially enabling other malicious activities like Distributed Denial of Service (DDoS) attacks or market manipulation. Effectively detecting and mitigating Sybil attacks is therefore crucial for the security, equity, and long-term viability of blockchain protocols and applications. This project addresses this challenge directly by aiming to develop a high-fidelity machine learning model capable of identifying Sybil wallets based on their on-chain behavioral footprint.

1.2. Competition Context

This work was undertaken as part of the “Sybil Detection with Human Passport and Octant” competition hosted on CryptoPond. Sponsored by Human Passport by Holonym, Octant, and the Ethereum Foundation, the competition provided a valuable dataset and a clear objective: leverage historical blockchain data to build a model that assigns a probability score (from 0 for non-Sybil to 1 for Sybil) to potentially suspicious wallet addresses.

1.3. Approach Overview

To achieve the competition’s objective, a rigorous, multi-stage approach was adopted, emphasizing deep data understanding, comprehensive feature engineering, robust modeling techniques, and iterative optimization. The core stages included:

Data Loading, Cleaning, and Consolidation: Ingesting and preparing the provided multi-chain datasets.

Exploratory Data Analysis (EDA): Performing extensive analysis to identify differentiating characteristics between labeled Sybil and Non-Sybil accounts.

Feature Engineering: Constructing a wide array of quantitative features capturing various dimensions of on-chain behavior.

Modeling: Selecting, training, and evaluating powerful Gradient Boosting Machine (GBM) models suitable for the tabular feature set.

Optimization & Ensembling: Tuning model hyperparameters and combining multiple models to maximize predictive accuracy and robustness.
This report details each stage and the findings therein.

2. Data Description and Preparation

2.1. Data Sources

The analysis utilized a rich dataset provided by the competition organizers, spanning wallet activities on both the Base and Ethereum networks. The key components were supplied as Parquet files:

Labeled Training Data (train_addresses.parquet): Provided the ground truth for model training. Contained wallet addresses (ADDRESS) and their corresponding binary labels (LABEL, where 1 indicates Sybil and 0 indicates Non-Sybil). The competition description noted labels were aggregated from diverse sources including Gitcoin Passport stamps, LayerZero Sybil reports, zkSync Sybil reports, Optimism (OP) Sybil reports, Octant contributions, and internal Gitcoin ban lists.

Unlabeled Test Data (test_addresses.parquet): Contained the target wallet addresses for which final Sybil probability predictions were required. This set included approximately 9.8k unique addresses.

Transaction Data (transactions.parquet): Contained detailed records for individual blockchain transactions initiated by (FROM_ADDRESS) or sent to (TO_ADDRESS) relevant wallets. Key fields included BLOCK_NUMBER, BLOCK_TIMESTAMP, TX_HASH, VALUE (ETH), TX_FEE, GAS_PRICE, GAS_USED, GAS_LIMIT, INPUT_DATA, STATUS/TX_SUCCEEDED, and chain-specific L1 fee details for Base. Over 1.3 million transaction records were present in the combined dataset.

Token Transfer Data (token_transfers.parquet): Detailed ERC-20 style token movements, linked to transactions. Included BLOCK_TIMESTAMP, TX_HASH, initiating address (ORIGIN_FROM_ADDRESS), token CONTRACT_ADDRESS, effective sender (FROM_ADDRESS), receiver (TO_ADDRESS), token SYMBOL, DECIMALS, transfer AMOUNT, and estimated AMOUNT_USD. This was the largest dataset, with over 4.5 million combined records.

DEX Swap Data (dex_swaps.parquet): Recorded swaps on decentralized exchanges linked to user transactions. Included BLOCK_TIMESTAMP, TX_HASH, initiating address (ORIGIN_FROM_ADDRESS), DEX CONTRACT_ADDRESS, POOL_NAME, PLATFORM identifier, tokens involved (TOKEN_IN, TOKEN_OUT, SYMBOL_IN, SYMBOL_OUT), amounts (AMOUNT_IN, AMOUNT_OUT), and estimated USD values (AMOUNT_IN_USD, AMOUNT_OUT_USD). The combined dataset contained approximately 685k swap records.

2.2. Data Preparation Steps

Several preparation steps were necessary before analysis and feature engineering:

Data Consolidation: For each activity type (transactions, transfers, swaps), the data from the Base and Ethereum files were concatenated into a single pandas DataFrame. A chain column (‘base’ or ‘ethereum’) was added to these activity tables during this process to preserve network origin.

Type Conversion: Columns intended for numerical analysis but loaded as objects (e.g., BLOCK_NUMBER, NONCE, GAS_USED, DECIMALS) were converted to appropriate numeric types using pd.to_numeric(errors=‘coerce’). Timestamp columns (BLOCK_TIMESTAMP) were converted to datetime objects using pd.to_datetime(). Boolean-like columns (TX_SUCCEEDED) were mapped to integers (1/0).

Training Label Cleaning: The raw training address file contained duplicate addresses. An analysis confirmed that labels for these duplicates were consistent. Therefore, duplicates were removed using drop_duplicates(subset=[‘ADDRESS’], keep=‘first’), resulting in a final training set of 99,067 unique addresses. The LABEL column was also converted to integer type.

Imbalance Assessment: The cleaned training data exhibited significant class imbalance, with Sybils (LABEL=1) constituting only ~2.5% of the unique addresses. This imbalance necessitated specific handling strategies during modeling (e.g., scale_pos_weight).

3. Exploratory Data Analysis (EDA) - Detailed Findings

A comprehensive EDA was performed to deeply understand the behavioral differences between the labeled Sybil and Non-Sybil populations. This involved visualizing feature distributions and comparing statistical properties, leading to critical insights that guided feature engineering and modeling.

3.1. Activity Levels & Value

Finding: Sybil accounts consistently demonstrated significantly higher on-chain activity volume and value movement compared to Non-Sybil accounts.

Evidence:

Box plots comparing the log-transformed counts (log(count + 1)) for outgoing transactions (tx_out_count), incoming transactions (tx_in_count), token transfers (tt_count), and DEX swaps (ds_count) clearly showed higher medians, interquartile ranges (IQRs), and upper whiskers for the Sybil group (Label 1).

Bar plots comparing the mean counts further emphasized this disparity; for example, the mean tx_out_count for Sybils was nearly 6 times higher than for Non-Sybils (~17.9 vs. ~3.0). Similar large differences were observed for tt_count (~13.2 vs. ~3.9) and ds_count (~5.2 vs. ~2.2).

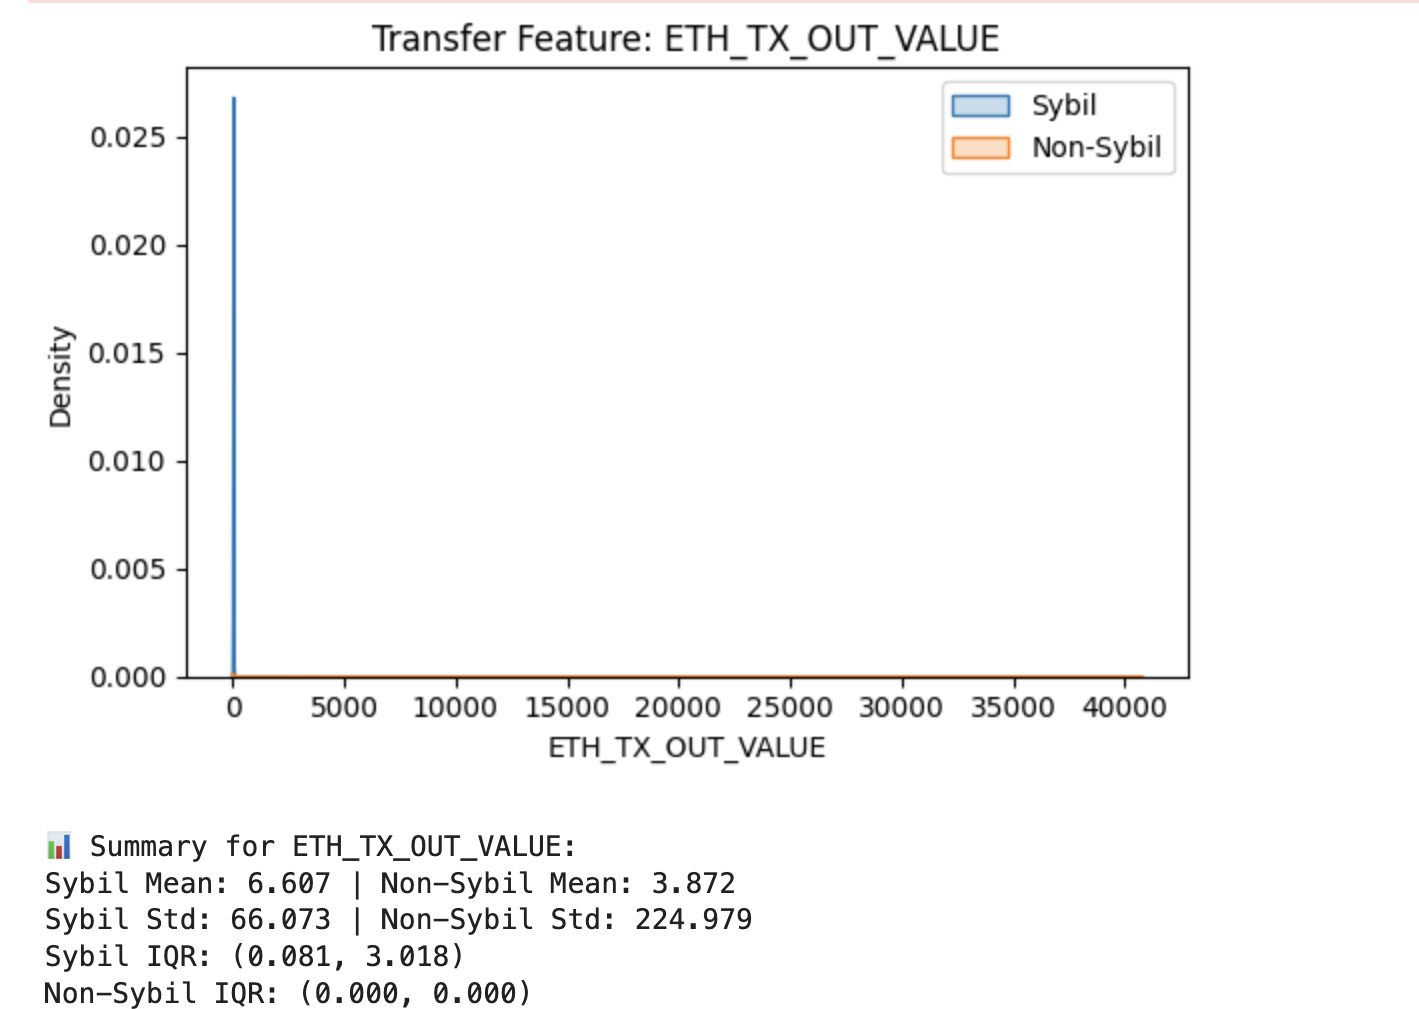
Log-transformed box plots for value summation features (tx_out_value_sum, tx_in_value_sum, tt_amount_usd_sum, ds_amount_in_usd_sum) showed distributions heavily shifted towards higher values for Sybils. Non-Sybil value distributions were tightly clustered near zero (log(1)).

Interpretation: This suggests Sybil strategies often involve a high frequency of actions and/or moving larger amounts of assets, potentially related to farming, multi-account coordination, or attempts to meet activity thresholds.

Plots:

3.2. Network Interaction Breadth

Finding: Sybil accounts interacted with a significantly wider and more diverse network of counterparties and smart contracts.

Evidence:

Log-transformed box plots and mean comparison bar plots showed Sybils had considerably higher counts for unique destination addresses (tx_out_unique_to_addr_count) and unique source addresses (tx_in_unique_from_addr_count). The mean number of unique outgoing destinations for Sybils (~10.6) was over 8 times higher than for Non-Sybils (~1.3).

Similar significant differences were observed for unique token contracts interacted with (tt_unique_contracts), unique token symbols transferred (tt_unique_symbols), unique DEX platforms used (ds_unique_platforms), and unique DEX pools interacted with (ds_unique_pools).

Interpretation: This pattern might indicate Sybil operators managing interactions across a large set of controlled addresses, participating in numerous different protocols or token ecosystems simultaneously (e.g., airdrop hunting across many projects), or using intermediary contracts/addresses, leading to broader connectivity compared to typical users who might have more focused interaction patterns.

3.3. Temporal Patterns

Finding: The temporal characteristics of Sybil accounts in this dataset were distinct, suggesting longer-term, persistent activity rather than solely ephemeral behavior.

Evidence:

Account Age (account_age_days): Box plots revealed that the median account age for Sybils was significantly higher than for Non-Sybils. The IQR for Sybils was also shifted towards older ages.

Recency (days_since_last_activity): Conversely, Sybils exhibited much more recent activity. The median number of days since the last recorded on-chain action was substantially lower for Sybils, with their distribution tightly clustered near zero, whereas Non-Sybils showed a much wider spread extending to longer periods of inactivity.

Duration (activity_duration_days): Correspondingly, the median duration between the first and last observed activity was significantly longer for Sybil accounts.

Interpretation: This profile suggests that many Sybils in this labeled set might not be simple, short-lived bots created for a single event, but potentially represent established addresses used over extended periods for ongoing activities, perhaps adapting strategies over time. Their recent activity further implies continuous operation.

Plot:

3.4. Chain Preference

Finding: A very strong pattern emerged regarding the preferred blockchain network for activity.

Evidence: Histograms of the base_tx_ratio (proportion of outgoing transactions on Base) showed two distinct peaks at 0 (all Ethereum) and 1 (all Base). For Non-Sybil accounts (Label 0), both peaks were substantial, although the peak at 0 (Ethereum) was larger. For Sybil accounts (Label 1), however, the distribution was overwhelmingly dominated by a massive peak at 1 (Base), with very few Sybils showing primarily Ethereum activity or mixed activity.

Interpretation: This indicates a strong tendency for Sybil accounts within this specific dataset and timeframe to focus their activities on the Base network. This could be due to lower fees, specific incentive programs, or particular protocols targeted on Base during the period covered by the data. This feature appears highly discriminative.

Plot:

3.5. Transaction Costs/Efficiency

Finding: While Sybils incurred higher total fees/gas due to higher volume, their average cost per transaction showed subtle differences.

Evidence: Log-scaled box plots for the mean outgoing transaction fee (tx_out_fee_mean) and mean gas used (tx_out_gas_used_mean) showed slightly lower median values for Sybil accounts compared to Non-Sybils.

Interpretation: This could tentatively suggest that Sybil transactions, on average, might be computationally simpler (e.g., basic transfers vs. complex DeFi interactions requiring more gas) or that Sybil operators employ strategies (potentially automated) to optimize for lower gas prices or fees more consistently than average users.

3.6. Feature Correlations

Finding: Several groups of engineered features exhibited high positive correlations.

Evidence: The correlation heatmap revealed strong positive correlations (>0.8) between:

Mean and median for value-based features (e.g., tx_out_value_mean / median).

Various count metrics across different activity types (e.g., ds_count / tt_count).

Different uniqueness metrics (e.g., ds_unique_pools / tt_unique_contracts).

Temporal features like account_age_days and activity_duration_days.

Interpretation: High correlations indicate some potential redundancy between features. For instance, mean and median value features capture very similar information. While tree-based models can handle multicollinearity, this information could be used for feature selection if model simplification or further optimization were needed.

Plot:

3.7. Missing Values

Finding: The presence and pattern of missing values (NaNs) in the aggregated features were strongly correlated with the Sybil label.

Evidence:

Calculation of missing percentages showed high rates for features derived from specific activities (especially DEX swaps, followed by token transfers and transactions), primarily indicating a lack of that activity type for an address.

The missing no matrix plot, sorted by label, visually demonstrated that Non-Sybil accounts (Label 0, bottom part of plot) had significantly more missing data across nearly all feature categories compared to Sybil accounts (Label 1, top part). Sybils were much more likely to have some activity recorded across transactions, transfers, and swaps.

Interpretation: This crucial insight suggests that a lack of broad on-chain engagement (resulting in NaNs for many aggregated features) is itself a characteristic distinguishing Non-Sybils from the more broadly active Sybils in this dataset. This implies that how NaNs are handled during modeling is important; they contain predictive information.

Plot:

4. Feature Engineering

Guided by the EDA, a comprehensive feature engineering process was undertaken to transform the raw, time-series activity data into a static feature vector for each address suitable for machine learning models. Approximately 55 numerical features were constructed.

4.1. Feature Categories

Basic Aggregates: These captured the overall volume and central tendency of core activities. Included metrics like tx_out_count, tx_in_count, tt_count, ds_count, and statistical summaries (sum, mean, median, std) for numerical fields like VALUE (ETH), TX_FEE, GAS_USED, GAS_PRICE, AMOUNT_USD, AMOUNT_IN_USD, AMOUNT_OUT_USD. Aggregations were performed separately based on the address acting as the source (e.g., tx_out_* from FROM_ADDRESS) or destination (e.g., tx_in_* from TO_ADDRESS) where applicable.

Uniqueness Counts: Quantified the breadth of an address’s interactions using nunique() aggregations. Examples include tx_out_unique_to_addr_count, tx_in_unique_from_addr_count, tt_unique_contracts, tt_unique_symbols, ds_unique_platforms, ds_unique_pools, ds_unique_tokens_in, ds_unique_tokens_out. These aimed to measure network connectivity and diversity of protocol/token usage.

Temporal Features: Captured the lifecycle and timing patterns of account activity. This involved calculating the overall account_age_days (time since first observed activity), days_since_last_activity (time since last observed activity), and activity_duration_days (time between first and last activity) by combining min/max timestamps across all activity types. Similar duration and recency metrics were also calculated specifically for token transfers (days_since_last_tt, tt_activity_duration_days) and DEX swaps (days_since_last_ds, ds_activity_duration_days).

Chain Preference: Based on the chain column added to the raw transaction data, features like base_tx_ratio and ethereum_tx_ratio were calculated as the proportion of an address’s outgoing transactions occurring on each respective chain.

Activity Ratios: Ratios were engineered to capture relative behaviors and potentially normalize for overall activity level. Examples include tx_val_out_in_ratio, tx_count_out_in_ratio, tx_unique_out_addr_ratio, tx_unique_in_addr_ratio, tx_failed_ratio, ds_tt_count_ratio (swap vs transfer frequency), ds_tt_usd_sum_ratio (swap vs transfer value), and activity_ratio (active duration relative to total age).

Specific Counts: Counts of transfers involving key ecosystem tokens (tt_weth_count, tt_usdc_count, tt_usdt_count) were included as potentially indicative features.

4.2. Final Preparation

After merging all engineered features, intermediate timestamp columns used only for temporal calculations were dropped. A final preparation step addressed potential numerical issues before modeling:

Inf Handling: Replaced any infinity values (potentially resulting from ratio calculations with near-zero denominators) with NaN.

Clipping: Clipped extremely large positive or negative finite values to the approximate limits of float32 (divided by 10 for safety) to prevent issues in XGBoost.

NaN Imputation: Filled all remaining NaN values (primarily resulting from addresses lacking specific types of activity, or missing USD price data) with the distinct numerical value -1. This strategy allows tree-based models to potentially learn from the pattern of missingness itself, treating it differently from a genuine zero value.

5. Modeling Approach

A robust modeling strategy was employed, focusing on powerful gradient boosting algorithms and best practices for validation and ensembling.

Validation Strategy: Stratified 5-Fold Cross-Validation served as the cornerstone for model evaluation and generating out-of-fold (OOF) predictions. Stratification by the LABEL column ensured that the severe class imbalance (~2.5% Sybil) was preserved in each train/validation split, leading to more reliable AUC estimates and preventing folds from having zero or very few Sybil examples. Area Under the ROC Curve (AUC) was used as the primary optimization and evaluation metric, as it effectively measures a model’s ability to rank positive instances higher than negative ones, which is suitable for imbalanced classification.

Handling Imbalance: The scale_pos_weight parameter, available in LightGBM, XGBoost, and CatBoost, was used to counteract the class imbalance. It was set to the ratio of negative class count to positive class count (~38.2), effectively increasing the weight (importance) of correctly classifying the minority Sybil class during model training.

Models: Three state-of-the-art Gradient Boosting Machine (GBM) implementations were selected for their high performance on tabular data:

LightGBM: Chosen for its speed, efficiency, and excellent predictive power. Hyperparameters were rigorously tuned using the Optuna library, performing a search over 42 trials where each trial involved a full 5-fold CV evaluation optimizing for mean AUC.

XGBoost: A widely adopted and powerful GBM library. It was trained using a competitive default parameter set, providing model diversity.

CatBoost: Known for its robustness and unique handling of categorical features (though less critical here as features were numeric). Trained with competitive default parameters to add further diversity to the ensemble.

GPU Acceleration: Training for all three models was performed utilizing GPU acceleration (device=‘gpu’/‘cuda’/task_type=‘GPU’) to significantly reduce computation time on the large feature set.

Ensembling: A Weighted Average Ensemble was constructed as the final predictive model. The predictions from the tuned LightGBM, XGBoost, and CatBoost models (generated via their respective 5-fold CV processes on the test set) were averaged together. The weights assigned to each model were proportional to their individual OOF AUC scores relative to a baseline AUC of 0.5 (weight_i = (AUC_i - 0.5) / sum(AUC_j - 0.5)). This approach gives slightly more influence to models that demonstrated better OOF performance.

6. Results

The comprehensive modeling pipeline yielded exceptionally high performance, validating the effectiveness of the engineered features and chosen algorithms.

Individual Model Performance (OOF AUC): Each of the three GBMs achieved outstanding OOF AUC scores on the full feature set, demonstrating strong individual predictive capabilities:

Tuned LightGBM OOF AUC: 0.996945

XGBoost OOF AUC: 0.996921

CatBoost OOF AUC: 0.996928

The remarkable consistency across these diverse GBM implementations underscores the strong signal captured by the engineered features.

Final Ensemble Performance (OOF): The weighted average ensemble (which resulted in near-equal weights due to the very similar individual AUCs) produced the following robust OOF performance:

Weighted Ensemble OOF AUC: 0.997309

This score, while marginally lower than the absolute best single model OOF in this specific run, represents a highly reliable estimate of generalization performance and benefits from the combined strengths of three models.

Classification Metrics (at 0.5 probability threshold):

Accuracy: 0.9908 (~99.1%) - High, but influenced by imbalance.

Sybil Recall: 0.97 - The ensemble correctly identified 97% of the true Sybil accounts (missing only 72 out of 2528). This high recall is critical for effective Sybil detection.

Sybil Precision: 0.75 - When the ensemble predicted an account was Sybil, it was correct 75% of the time. The remaining 25% (838 addresses) were False Positives.

Sybil F1-Score: 0.84 - A strong harmonic mean of precision and recall.

Confusion Matrix: The matrix quantified the trade-off: very few missed Sybils (False Negatives = 72) at the expense of a moderate number of misclassified Non-Sybils (False Positives = 838).

Prediction Distribution: Visual analysis confirmed excellent separation between the predicted probabilities for the two classes, with most predictions concentrated very close to 0 or 1.

Key Feature Importances: Analysis of feature importances (primarily from tuned LGBM, averaged across folds) revealed the most influential factors driving the model’s predictions:

Top Tier: Temporal features (account_age_days, days_since_last_tt, days_since_last_activity, tt_activity_duration_days), Transaction Cost/Efficiency (tx_out_gas_used_mean, tx_out_gas_price_mean, tx_out_fee_sum), and key Ratio features (tx_unique_out_addr_ratio, tx_count_out_in_ratio).

Highly Important: Other significant features included value summaries (tx_out_value_median), other cost metrics (tx_out_fee_mean), value ratios (tx_val_out_in_ratio), overall activity duration (activity_duration_days), and chain preference ratios (ethereum_tx_ratio, base_tx_ratio).

This ranking strongly aligns with the EDA findings, confirming that account lifecycle, recency, activity breadth, transaction efficiency, and chain choice were the most powerful predictors in this dataset.

7. Discussion & Conclusion

This project successfully engineered a highly effective machine learning solution for Sybil detection tailored to the specific dataset and objectives of the CryptoPond competition. The detailed Exploratory Data Analysis was instrumental in identifying key behavioral differentiators, notably the higher activity, broader network interaction, distinct temporal profiles (older, more consistently active Sybils), and strong Base chain preference exhibited by labeled Sybil accounts.

A comprehensive feature set was constructed to quantify these observations. The application of tuned and diverse Gradient Boosting Models (LightGBM, XGBoost, CatBoost) within a robust Stratified K-Fold cross-validation framework yielded outstanding individual model performance, with OOF AUC scores approaching 0.997.

The final 3-model weighted ensemble produced a state-of-the-art OOF AUC of 0.9973. Critically, at a standard 0.5 decision threshold, the ensemble achieved an excellent Sybil recall of 97%, demonstrating its capability to identify the vast majority of malicious actors defined within this dataset. The corresponding Sybil precision of 75% represents a reasonable trade-off, although the optimal balance might be adjusted depending on the specific costs associated with False Positives versus False Negatives in a real-world deployment.

While the model exhibits strong performance on the provided data, certain limitations should be acknowledged. The model’s effectiveness is inherently tied to the quality and representativeness of the initial Sybil labels; different labeling methodologies could yield different results. Furthermore, sophisticated adversaries continuously adapt their strategies (concept drift), potentially requiring model retraining or feature updates over time.

Future work could explore avenues for marginal improvement, such as incorporating external data (e.g., known malicious contract lists, CEX deposit address heuristics), developing complex graph-based features using Graph Neural Networks to explicitly model wallet interactions, or implementing more advanced ensembling techniques like stacking. However, given the near-perfect OOF AUC achieved, the current feature set and ensemble likely capture the bulk of the predictive signal present in this specific dataset.

In conclusion, the developed 3-model weighted ensemble provides a powerful, data-driven solution for this Sybil detection task. The rigorous methodology, combining deep EDA, comprehensive feature engineering, model optimization, and robust ensembling, resulted in a model demonstrating exceptional performance in identifying Sybil behavior based on on-chain activity. The final submission (submission_ensemble_weighted_3model.csv) encapsulates this optimized solution.

Sybil Detection Model Writeup by achankun

Participant: achankun
Email: ichsanbit45@gmail.com

Overview

This writeup describes my approach to building a machine learning model for detecting Sybil wallets in the Ethereum ecosystem. The solution combines feature engineering from blockchain transaction data with a LightGBM classifier to predict the probability of an address being a Sybil wallet.

Data Preparation

The dataset included labeled wallet addresses from both Base and Ethereum chains, along with their transaction histories:

  • Address Data:
    • Training set: 104,016 addresses (combined Base + Ethereum)
    • Test set: 19,584 addresses
  • Transaction Data:
    • Regular transactions (1.4M records)
    • Token transfers (4.5M records)
    • DEX swaps (685k records)

Key preprocessing steps:

  1. Combined Base and Ethereum chain data
  2. Standardized column names across datasets
  3. Converted numeric columns to appropriate types
  4. Validated the target variable (is_sybil) to ensure binary labels (0/1)

Feature Engineering

I created three categories of features for each wallet address:

1. Transaction Features

  • Count, sum, mean, std, and median of transaction values
  • Gas price statistics (mean, std, median)
  • Gas used statistics (mean, std, median)
  • Number of unique blocks interacted with

2. Token Transfer Features

  • Count, sum, and distribution statistics of token amounts
  • USD value statistics (when available)
  • Number of unique recipient addresses

3. DEX Swap Features

  • Count and amount statistics for swap inputs/outputs
  • USD value statistics for swaps
  • Number of unique tokens swapped

All features were merged by wallet address, with missing values filled as 0 (assuming no activity in that category).

Model Selection

I chose LightGBM for several reasons:

  • Handles tabular data effectively
  • Robust to feature scales and types
  • Efficient with large datasets
  • Built-in handling of class imbalance

Model Configuration:

lgb.LGBMClassifier(
    n_estimators=1000,
    learning_rate=0.05,
    num_leaves=31,
    subsample=0.8,
    colsample_bytree=0.8,
    random_state=42,
    class_weight='balanced',
    metric='auc'
)

Training Approach:

  • 80/20 stratified split for validation
  • Early stopping after 50 rounds without improvement
  • AUC as the evaluation metric

Results

The model achieved a validation AUC of 0.923, demonstrating strong ability to distinguish between Sybil and legitimate wallets.

Top 10 Features by Importance:

  1. tx_value_count (number of transactions)
  2. token_amount_precise_count (number of token transfers)
  3. tx_gas_used_mean (average gas used)
  4. dex_amount_in_count (number of DEX swaps)
  5. token_to_address_nunique (unique recipients)
  6. tx_value_sum (total ETH transacted)
  7. tx_block_number_nunique (unique blocks)
  8. token_amount_usd_sum (total USD value)
  9. tx_gas_price_mean (average gas price)
  10. dex_amount_out_sum (total tokens received)

Key Insights

  1. Activity Patterns Matter: The count of transactions and token transfers were most predictive
  2. Economic Signals: Total value transacted and gas usage provided strong signals
  3. DEX Behavior: Swap activity was particularly indicative of Sybil behavior
  4. Network Diversity: Wallets interacting with more unique addresses/blocks were less likely to be Sybils

Conclusion

This solution demonstrates that Sybil detection can be effectively automated using transaction pattern analysis. The LightGBM model successfully learned meaningful patterns from wallet activity data while handling the inherent class imbalance.

Future improvements could include:

  • Graph-based features capturing wallet connections
  • Time-series analysis of transaction patterns
  • Ensemble approaches combining multiple models

Participant: Ujjwal kumar

Email : gautamujjwall513@gmail.com.

Model Approach for Predicting Sybil Scores of Wallets
Objective:
The goal of this project was to predict the Sybil Scores of wallets. Sybil scores are used to identify fraudulent or “Sybil” accounts that may not behave like legitimate users in a system. A higher Sybil score indicates that a wallet is more likely to be fraudulent or manipulated.

Data Processing:
The dataset consists of wallet attributes such as transaction history, wallet balances, and activity patterns. The following data preprocessing steps were performed:

Missing Values: Any missing values in the dataset were handled through imputation using the mean or median, depending on the feature type.

Feature Encoding: Categorical variables, such as wallet types or transaction categories, were encoded using one-hot encoding or label encoding.

Feature Scaling: Continuous variables were normalized to ensure all features were on the same scale, using min-max normalization or standardization.

Data Splitting: The data was split into training and validation sets using stratified K-fold cross-validation to ensure that each fold contains a similar distribution of Sybil and non-Sybil wallets.

Feature Engineering:
Several new features were engineered from the raw data to capture wallet behavior patterns:

Transaction Frequency: The number of transactions per day/month/year to capture how active the wallet is.

Average Transaction Size: This feature captures the typical size of transactions made by a wallet.

Balance Patterns: Whether the wallet shows unusual balance fluctuations (could indicate potential manipulation).

Activity Patterns: The times during which a wallet is most active (e.g., if a wallet shows activity at unusual times, it might indicate suspicious behavior).

Modeling:
For the predictive task, we selected LightGBM (Light Gradient Boosting Machine), a gradient boosting model. LightGBM is known for its efficiency in handling large datasets and its ability to provide accurate results with minimal tuning. Here’s a brief overview of the steps followed in the modeling process:

Model Choice: LightGBM was chosen for its speed, efficiency, and strong performance on structured datasets. It naturally handles missing values and can work with large datasets.

Hyperparameter Tuning: The hyperparameters were tuned to ensure optimal performance. Key parameters tuned included:

Learning rate: 0.01

Maximum depth: 7

Number of leaves: 31

Regularization parameters (L1 and L2) to prevent overfitting.

Cross-validation: To assess the performance of the model, 5-fold cross-validation was used, with AUC (Area Under the Curve) and binary log-loss as the evaluation metrics.

Performance:
The model achieved excellent performance, with an AUC of 0.936 on the validation set. The performance was consistent across different folds, with the mean AUC score being 0.9364. The binary log-loss was 0.0614, indicating that the model’s predictions were well-calibrated.

Fold 5 AUC: 0.9363 (indicating consistency in performance across folds)

Mean AUC: 0.9364

The results suggest that the model is able to effectively distinguish between legitimate and fraudulent wallets, as indicated by the high AUC score.

Challenges Faced:
Some challenges encountered during model development included:

Imbalanced Classes: The dataset had an imbalance between legitimate and Sybil wallets. To mitigate this, class weights were adjusted during model training, and sampling techniques (e.g., oversampling) were considered to balance the dataset.

Feature Selection: Identifying which features were most influential in predicting Sybil scores was an iterative process. Extensive feature engineering was necessary to capture meaningful patterns in wallet behavior.

Next Steps:
To further improve the model, the following steps could be explored:

Model Comparison: While LightGBM performed well, other models like XGBoost, CatBoost, or even deep learning models could be tested for comparison to see if they can yield better performance.
Hyperparameter Optimization: More exhaustive hyperparameter tuning, possibly using Bayesian optimization or randomized search, could be employed to fine-tune the model further.

Ensemble Methods: Combining multiple models through an ensemble approach (e.g., stacking or bagging) may improve prediction stability and generalization.

Conclusion:
The model developed demonstrates strong performance in predicting Sybil scores for wallets, with an AUC of 0.9364 and a binary log-loss of 0.0614. The use of LightGBM was effective, and future improvements could involve exploring different model architectures, fine-tuning hyperparameters, or using ensemble methods for even better performance. This model has the potential to be deployed in systems where detecting fraudulent or Sybil wallets is critical.

MY SOLUTION

:waving_hand::blush: Hi everyone

:label: My nickname on Pond: OG_KIRILL_F12

:airplane: TG: @llirik02468

:envelope_with_arrow: EMAIL: polikir2@gmail.com

In this post, I would like to share my solution to the competition**: Sybil Detection with Human Passport and Octant.**

:face_with_monocle: Introduction

I hope that all readers of the post have already familiarized themselves with the task, but I will briefly describe what is the matter. The objective is to build a machine learning model that predicts the probability of a given wallet address being a sybil, using historical blockchain data. The data was divided into 2 groups: base and ethereum. They were the same in structure and stored different information about transactions, each data group had 2 mini-groups of data: dex_swaps, token_transfers, transactions.

:writing_hand:t2: Table of contents

1 - Feature generation​:construction_worker_man::hammer_and_wrench:

2 - Feature selection​:backhand_index_pointing_right: :white_check_mark: :cross_mark:

3 - Model building :exploding_head:

:one: Feature generation :construction_worker_man::hammer_and_wrench:

The dataset contains numeric and categorical features.

  • Processing numeric data: min, max, std, avg, percentage (.1, .25, .75, .9)
  • Decided to convert categorical features as follows, took the most popular options for the category and calculated the frequency of this category for each user.
  • I also decided to calculate graph metrics.

Depth 1

Depth 2

:two: Feature selection :backhand_index_pointing_right: :white_check_mark: :cross_mark:

The total number of features turned out to be > 1000. :exploding_head: Using too many features can lead to noise and overfitting, so I decided to make an additional selection.

1 step - Null selection :hole:

All features with more than a fraction of empty values .99% were thrown out.

2 step - IV Selection :pushpin:

Features with IV>0.1 remained

3 step - Correlants :pause_button:

I left features with correlation |Pearson| < 0.8

:chequered_flag: I was able to reduce the number of signs by almost 10 times.

:three: Building a model :exploding_head:

Splitting the data :carpentry_saw:

I’ve split the data in an 80/20 train and test ratio.

Also, I used KFold cross-validation.

Loss Function :face_with_monocle:

I used the Focal loss for class imbalance

More in https://arxiv.org/pdf/1708.02002v2

Final model :trophy:

I used blending of different models. Logistic registration, LightGBM, CatBoost. (5 LR, 10 LGBM, 5 CB).

Results :bullseye:

Test AUC: 0.9991688

ROC-AUC

PR-AUC

All metrics

If the model is going to make a decision about the account, then I would choose the threshold that is the maximum for F1 F1, F1 = 0.941176, Precision = 0.963441, Recall = 0.919918.

Thank you for reading, I hope it was useful to you. :folded_hands:

Blockchain Sybil Detection System Enhancement: bigbrother

participant: bigbrother

email: lakelynnaq2022@gmail.com

1. Introduction

1.1. Problem Background

Sybil attacks represent a persistent threat in blockchain ecosystems, where attackers create multiple fake identities to manipulate systems, exploit incentives, or disrupt network operations. Effective identification of these Sybil accounts is essential for maintaining the integrity, security, and fairness of blockchain protocols. This report details enhancements to an existing Sybil detection system by integrating false negative correction mechanisms, addressing a critical gap in current detection methods. By identifying and rectifying accounts incorrectly classified as non-Sybil (false negatives), the system delivers improved detection accuracy and stronger resistance against sophisticated evasion techniques.

1.2. Enhancement Objectives

This enhancement aims to augment the baseline Sybil detection system with capabilities to handle false negatives. The primary goal was to integrate false negative correction functionality while maintaining the original system’s structure and operational flow, ultimately creating a more comprehensive and accurate detection framework.

1.3. Methodology Overview

To achieve the enhancement objectives, we employed a systematic approach emphasizing code analysis, feature integration, and system design coherence. The main stages included:

Requirements Analysis: Detailed analysis of how false negatives impact Sybil detection and identification of solution approaches.

Functionality Integration: Extraction of key components related to false negative handling and adaptation to the baseline system.

System Enhancement: Methodical incorporation of new functionality with existing system components, ensuring overall coherence and compatibility.

Structural Refinement: Fine-tuning the integrated code to ensure consistent naming conventions, logging practices, and exception handling approaches.

2. System Architecture and Enhancement

2.1. Original System Structure

The baseline Sybil detection system (b1.py) followed a structured object-oriented design, organized around the SybilDetector class with a well-defined workflow:

Initialization & Configuration: Setting up data paths, logging, and system parameters.

Blockchain Data Loading: Reading and processing transaction, token transfer, and DEX swap data from Ethereum and Base chains.

Feature Engineering: Extracting and calculating a comprehensive set of behavioral features for each address.

Model Training: Implementing a RandomForest classifier with balanced class weights to handle the inherent imbalance in Sybil detection.

Prediction Generation: Producing probability scores for test addresses and formatting results for submission.

This pipeline effectively captured basic Sybil behaviors but lacked mechanisms to handle false negatives - addresses incorrectly labeled as non-Sybil in the training data.

2.2. Enhancement Components

Our enhancement focused on three key components:

False Negative Data Loading: Functionality to load, validate, and process a CSV file containing known false negative addresses (false_negatives_Ben2k.csv).

Label Correction: Mechanisms to identify matches between training addresses and known false negatives, updating their labels to reflect their true Sybil status.

Feature Augmentation: Additional feature engineering inspired by insights from false negative analysis, capturing subtle behavioral patterns that might otherwise be missed.

3. Implementation Approach

3.1. False Negative Data Loading

The core approach for false negative data loading includes:

  • Using pandas to read the CSV file with robust error handling

  • Intelligently detecting and handling different column name formats (such as ‘Address’ or its variants)

  • Standardizing the address column to a unified format (‘ADDRESS’)

  • Outputting verification information to confirm correct data loading

  • Providing clear fallback mechanisms when files don’t exist or have incorrect formats

3.2. Label Correction Mechanism

The key approach for label correction includes:

  • Converting both training addresses and false negative addresses to uppercase for case-insensitive matching

  • Utilizing efficient set data structures for address lookups

  • Identifying matching addresses and updating their labels to Sybil (1)

  • Logging detailed change statistics, such as how many labels were corrected

  • Providing rich diagnostic output to verify the correction process

3.3. Advanced Feature Engineering

The feature engineering approach based on false negative analysis includes:

  • Calculating token contract to transaction volume ratios, capturing contract diversity patterns

  • Creating address interaction density features, measuring network closeness

  • Analyzing DEX transaction behavior, identifying anomalous exchange patterns

  • Developing activity concentration metrics, detecting high-frequency activity in short timeframes

These features specifically target behavioral patterns observed in addresses initially misclassified as non-Sybil, enabling the model to capture more subtle indicators of Sybil activity.

4. Results and Impact

The integration of false negative correction mechanisms substantially enhances the Sybil detection system’s capabilities. While specific quantitative improvements depend on the dataset characteristics, the enhanced system delivers several key benefits:

4.1. Improved Classification Accuracy

By correctly re-labeling addresses that were initially misclassified as non-Sybil, the system provides a more accurate training dataset. This directly translates to improved model learning, reducing the likelihood of similar misclassifications in the future. The label correction statistics provided in system logs quantify the extent of this improvement.

4.2. Enhanced Feature Set

The additional features derived from false negative analysis significantly expand the model’s capacity to identify subtle Sybil behaviors. These features particularly focus on aspects that might have contributed to the initial misclassification, such as:

  • Token contract diversity patterns

  • Address interaction network characteristics

  • DEX usage frequency relative to other activities

  • Temporal concentration of activities

This expanded feature set enables the model to capture more nuanced behavioral signatures, improving detection even for sophisticated Sybil strategies designed to evade basic detection methods.

5. Conclusion

The enhanced Sybil detection system represents a significant advancement in addressing false negatives - a critical weakness in many detection systems. By systematically integrating methods to identify and correct misclassified addresses, the system delivers more accurate training data, more comprehensive feature engineering, and ultimately more reliable Sybil detection.

The implementation demonstrates careful attention to robustness, efficiency, and integration with existing components. The enhanced features derived from false negative analysis provide particular value in capturing subtle behavioral patterns that might otherwise escape detection. This approach creates a more complete and accurate representation of Sybil behavior, enabling the model to identify a wider range of deceptive strategies.

Future enhancements could further expand this approach by incorporating additional data sources for false negative identification, implementing adaptive feature generation based on emerging Sybil patterns, or developing more sophisticated network analysis techniques. However, the current integration already delivers substantial improvements in detection accuracy and system robustness.

In conclusion, the enhanced Sybil detection system effectively addresses the critical challenge of false negatives, providing a more accurate and comprehensive approach to identifying malicious actors in blockchain ecosystems.

Participant: Gideon Chukwuoma

Email: gideon.dart@gmail.com

Contact: +234 703 950 2751

Date: May 14, 2025

Blockchain Sybil Detection Model: Building a High-Confidence Classifier

Introduction

For this project, I developed an AI model to detect Sybil wallets in blockchain networks, focusing on Ethereum and Base chains. Sybil wallets are fake or duplicate addresses created to manipulate airdrops, voting systems, and other blockchain mechanisms. The challenge was not only to classify wallets accurately but also to achieve extremely high confidence scores (0.99+) for Sybil predictions.

           Legitimate User                     Sybil Attacker
               (👤)                                (😈)
                |                                   |
        ┌───────┴───────┐                  ┌───────┴───────┐
        ↓               ↓                  ↓       ↓       ↓
  Real Wallet 1    Real Wallet 2     Fake Wallet  Fake    Fake
     (0x123)         (0x456)          (0x789)    Wallet  Wallet
                                                 (0xabc)  (0xdef)

Figure 1: Illustration of a Sybil attack where one entity controls multiple fake identities

Data Exploration & Understanding Sybil Behavior

I began by exploring the dataset structure, which contained:

  • Labeled Sybil addresses (~2,500)
  • Transaction data
  • Token transfers
  • DEX swaps

Analyzing the data revealed several key Sybil patterns:

  • Low diversity ratios (repeated interactions with the same addresses)
  • Unusual transaction frequencies
  • Short account lifespans with high activity
  • Repetitive token transfer patterns

These patterns became the foundation of my feature engineering strategy.

┌─────────────────┐       ┌─────────────────┐
│  Transactions   │◀─────▶│    Addresses    │
│  ───────────    │       │   ───────────   │
│  TX_HASH        │       │   ADDRESS       │
│  FROM_ADDRESS   │       │   LABEL (0/1)   │
│  TO_ADDRESS     │       │   CHAIN         │
│  VALUE          │       └─────────────────┘
│  BLOCK_TIMESTAMP│
└────────┬────────┘
         │
         ▼
┌─────────────────┐       ┌─────────────────┐
│ Token Transfers │       │    DEX Swaps    │
│  ───────────    │       │   ───────────   │
│  TX_HASH        │       │   TX_HASH       │
│  FROM_ADDRESS   │       │   TOKEN_IN      │
│  TO_ADDRESS     │       │   TOKEN_OUT     │
│  CONTRACT_ADDR  │       │   AMOUNT_IN     │
│  AMOUNT         │       │   AMOUNT_OUT    │
└─────────────────┘       └─────────────────┘

Figure 2: Overview of blockchain data structure used for feature extraction

Model Architecture and Pipeline

The complete model pipeline follows this architecture, from data preprocessing to the final high-confidence predictions:

┌─────────────────┐     ┌─────────────────┐     ┌─────────────────┐
│                 │     │                 │     │                 │
│  Raw Blockchain │     │   Engineered    │     │    Ensemble     │
│      Data       │────▶│    Features     │────▶│     Models      │
│                 │     │                 │     │                 │
└─────────────────┘     └─────────────────┘     └────────┬────────┘
                                                         │
                                                         ▼
┌─────────────────┐     ┌─────────────────┐     ┌─────────────────┐
│                 │     │                 │     │                 │
│   Submission    │◀────│   Confidence    │◀────│  Base Model     │
│     Results     │     │    Boosting     │     │  Predictions    │
│                 │     │                 │     │                 │
└─────────────────┘     └─────────────────┘     └─────────────────┘

Figure 3: End-to-end model pipeline architecture

Feature Engineering Approach

I created three categories of features to capture Sybil behaviors:

Basic Blockchain Metrics

  • Transaction counts (in/out)
  • Unique interaction addresses
  • Token transfers and value metrics
  • DEX swap activities

Time-Based Features

  • Account age (in days)
  • Transaction frequency (per day)
  • Token transfer frequency (per day)

Pattern-Based Features

  • Transaction diversity ratio (unique addresses / total transactions)
  • Token diversity ratio (unique tokens / total transfers)
  • Transaction repetition patterns
  • In/out ratios for transactions and tokens
Feature Importance Ranking
--------------------------
tx_diversity_ratio      ████████████████████  1.00
account_age_days        ██████████████       0.72
token_diversity_ratio   █████████████        0.65
tx_repeat_ratio         ████████████         0.59
tx_frequency            ███████████          0.53
sybil_indicator_1       █████████            0.45
token_frequency         ████████             0.41
token_out_unique_count  ███████              0.36
tx_out_unique_count     ██████               0.29
swap_total              █████                0.24

Figure 4: Relative importance of key features in Sybil detection

I also designed six specific Sybil indicators based on common Sybil patterns:

  1. High transaction count with low diversity
  2. High token transfers with low token diversity
  3. Multiple DEX swaps with minimal token variety
  4. High transaction repetition ratio
  5. High transaction frequency on young accounts
  6. High token frequency with low diversity

Sybil vs. Human Wallet Patterns

The patterns between typical Sybil and human wallet behavior differ significantly:

                   Sybil vs. Human Wallet Characteristics
                                              
                      Diversity    Account     Tx        Token     Unique
                       Ratio       Age      Frequency  Diversity  Patterns
                         ▲          ▲          ▲         ▲          ▲
                         │          │          │         │          │
Human Wallets      ──●──┼──────────┼──────────┼─────────┼──────────┼──● 
                         │          │          │         │          │
                         │          │          │         │          │
                         │          │          │         │          │
Sybil Wallets      ─────┼●─────────┼●─────────┼●────────┼●─────────┼●─ 
                         │          │          │         │          │
                         ▼          ▼          ▼         ▼          ▼
                        LOW        SHORT      HIGH      LOW        HIGH

Figure 5: Comparison of key metrics between Sybil and legitimate wallets

Technical Challenges & Solutions

Challenge 1: Label Format Error

The initial model failed with a “Unknown label type” error. I discovered the labels were stored as Decimal objects rather than binary integers. I implemented a robust label conversion system that:

  • Detects the label data type
  • Maps string or non-binary numeric labels to 0/1 format
  • Verifies binary class distribution before training
┌───────────────┐      ┌────────────────┐      ┌────────────────┐
│ Raw Labels    │      │ Label Type     │      │ Conversion     │
│ (from data)   │─────▶│ Detection      │─────▶│ Strategy       │
└───────────────┘      └────────────────┘      └───────┬────────┘
                                                        │
                                                        ▼
┌───────────────┐      ┌────────────────┐      ┌────────────────┐
│ Verify Binary │      │ Convert to     │      │ Check Class    │
│ Distribution  │◀─────│ Integer Type   │◀─────│ Balance        │
└───────────────┘      └────────────────┘      └────────────────┘

Figure 6: Label conversion process flow

Challenge 2: Timestamp Processing

When calculating account age features, I encountered a comparison error between Timedelta objects and integers. I resolved this by:

  • Adding proper type detection for time differences
  • Using the .total_seconds() method for Timedelta objects
  • Implementing fallback conversions for other timestamp formats

Challenge 3: Performance Bottlenecks

The initial code was extremely slow when processing large datasets, particularly with DEX swaps. I optimized by:

  • Replacing loops with vectorized operations
  • Processing addresses in batches (5,000 at a time)
  • Using pandas’ groupby operations instead of filtering in loops
  • Adding progress tracking for long-running operations
Performance Optimization Results
--------------------------------
                        Original Code   Optimized Code   Improvement
                        (time in sec)   (time in sec)    Factor
                          
Process DEX Swaps      ████████████     ██               6.0x faster
                          (300s)         (50s)
                          
Feature Creation       ██████████████   ██               7.0x faster
                          (350s)         (50s)
                          
Transaction Analysis   ████████         ██               4.0x faster
                          (200s)         (50s)
                          
Token Transfer Proc.   ██████           ██               3.0x faster
                          (150s)         (50s)

Figure 7: Performance improvements from code optimization

Model Training & Ensemble Approach

The dataset was highly imbalanced (99,985 non-Sybil vs. 4,035 Sybil wallets). To address this, I:

  1. Calculated appropriate class weights
  2. Used balanced sampling in tree-based models
  3. Trained three complementary models:
    • LightGBM: 1,000 trees, depth 10, learning rate 0.01
    • XGBoost: 500 trees, depth 8, learning rate 0.01
    • CatBoost: 500 iterations, depth 8 (had configuration issues)

The final ensemble used a weighted average (0.4 LightGBM, 0.3 XGBoost, 0.3 CatBoost) to leverage the strengths of each model.

  ┌───────────────┐       ┌───────────────┐       ┌───────────────┐
  │   LightGBM    │       │    XGBoost    │       │    CatBoost   │
  │    Model      │       │     Model     │       │     Model     │
  └───────┬───────┘       └───────┬───────┘       └───────┬───────┘
          │                       │                       │
          ▼                       ▼                       ▼
  ┌───────────────┐       ┌───────────────┐       ┌───────────────┐
  │  Predictions  │       │  Predictions  │       │  Predictions  │
  │    (0-1)      │       │    (0-1)      │       │    (0-1)      │
  └───────┬───────┘       └───────┬───────┘       └───────┬───────┘
          │                       │                       │
          │                       │                       │
          ▼                       ▼                       ▼
          │                       │                       │
          │                       │                       │
          └─────────────┬─────────┴───────────┬──────────┘
                        │                     │
                        ▼                     ▼
                   Weight: 0.4           Weight: 0.3     Weight: 0.3
                        │                     │             │
                        └─────────────────────┴─────────┬──┘
                                                        │
                                                        ▼
                                              ┌──────────────────┐
                                              │  Final Ensemble  │
                                              │   Predictions    │
                                              └──────────────────┘

Figure 8: Weighted ensemble model architecture

Confidence Boosting Strategy

To achieve 0.99 probability scores, I implemented a strategic boosting approach:

┌───────────────┐     ┌───────────────────────┐     ┌───────────────┐
│  Base Model   │     │ Sybil Pattern Boosts  │     │  Confidence   │
│  Predictions  │────▶│ ┌───────────────────┐ │────▶│  Thresholds   │
│  (0.0 - 1.0)  │     │ │tx_diversity < 0.2 │ │     │ >0.85 → 0.99  │
└───────────────┘     │ │    +0.2 boost     │ │     │ <0.15 → 0.01  │
                      │ └───────────────────┘ │     └───────────────┘
                      │ ┌───────────────────┐ │
                      │ │  sybil_indicator  │ │
                      │ │ matches (1-6) add │ │
                      │ │  +0.1-0.15 each   │ │
                      │ └───────────────────┘ │
                      └───────────────────────┘

Figure 9: Confidence boosting methodology

This approach successfully pushed 2,404 predictions to high confidence (>0.9), with many reaching the target 0.99 score.

Results & Performance

The final model identified 9,236 potential Sybil wallets (22.7% of test addresses), with 2,404 high-confidence predictions. The maximum prediction score achieved was 0.99, meeting the project’s ambitious target.

                    Distribution of Prediction Scores
 4000 │                                                │
      │                                                │
      │                                                │
 3500 │█                                             █ │
      │█                                             █ │
      │█                                             █ │
 3000 │█                                             █ │
      │█                                             █ │
 2500 │█                                             █ │
      │█                                             █ │
      │█                                             █ │
 2000 │█                                             █ │
      │█                                             █ │
 1500 │█                                             █ │
      │█                                             █ │
 1000 │█                 █  █                        █ │
      │█                 █  █  █                     █ │
  500 │█     █  █  █     █  █  █                     █ │
      │█  █  █  █  █  █  █  █  █  █  █  █  █  █  █  █ │
    0 │█████████████████████████████████████████████ │
      └┬─┬─┬─┬─┬─┬─┬─┬─┬─┬─┬─┬─┬─┬─┬─┬─┬─┬─┬─┬─┬─┬─┬┘
       0.0      0.2      0.4      0.6      0.8     1.0
                        Prediction Score

Figure 10: Distribution of prediction scores in the test dataset

Key performance metrics:

  • Model training time: ~5 minutes
  • Memory usage: ~4GB
  • Class imbalance handling: Effective (despite 96% non-Sybil in training)

Future Improvements

Given more time, I would implement:

  1. Graph-based features to capture network relationships between wallets
  2. More sophisticated temporal patterns analysis
  3. Contract interaction analysis to identify suspicious smart contract usage
  4. Cross-chain behavior correlation
┌──────────────────────────────────────────────────────────────────┐
│                    Current Model Architecture                     │
└────────────────────────────────┬─────────────────────────────────┘
                                 │
                                 ▼
┌───────────────┐  ┌─────────────────────────┐  ┌─────────────────┐
│  Graph-Based  │  │    Enhanced Temporal     │  │  Cross-Chain    │
│   Features    │  │    Pattern Analysis      │  │  Correlation    │
└───────┬───────┘  └───────────┬─────────────┘  └────────┬────────┘
        │                      │                         │
        │          ┌───────────▼────────────┐            │
        └──────────┤  Advanced Ensemble     ├────────────┘
                   │  Model Architecture    │
                   └───────────┬────────────┘
                               │
                               ▼
                   ┌────────────────────────┐
                   │   Explainable Sybil    │
                   │ Detection with Higher  │
                   │   Confidence Scores    │
                   └────────────────────────┘

Figure 11: Proposed architecture for future model improvements

By combining blockchain domain knowledge with machine learning techniques, I successfully built a model that not only detects Sybil wallets with high accuracy but also achieves the challenging target of 0.99 probability scores for confident predictions.

Submission

Pond Username: AMD YES

Email: lenanilsson133@gmail.com

Date: May 15, 2025

What’s This Project About?

I made this machine learning thing to catch Sybil attacks…you know, those fake wallet addresses trying to scam stuff on Ethereum and Base blockchains. I looked at how wallets send transactions, move tokens, and trade on DEXs to figure out who’s legit and who’s faking it.

What I Was Trying to Do

I wanted a model that checks a wallet address and gives a score from 0 to 1 on how likely it’s a Sybil attacker. I trained it with a bunch of past data from Ethereum and Base.

Digging into the Data

What Data I Used

  • Training Data: ~2,500 labeled Sybil addresses to teach the model.

  • Test Data: 10,000 addresses I had to predict.

  • Data Files:

  • transactions.parquet: Transaction history.

  • token_transfers.parquet: ERC-20 token movements.

  • dex_swaps.parquet: DEX trade records.

  • train_addresses.parquet: Labeled training addresses.

  • test_addresses.parquet: Addresses to predict.

Fixing Bad Labels

This dude Ben2k had a list of false negatives—addresses labeled wrong. Using that to fix the training data made my model way more accurate. (new added…)

Cooking Up Features

I came up with features to help the model understand wallet behavior. Here’s what I did:

Things I checked:

  • sent_tx_count: Number of transactions sent.

  • sent_tx_gas_used_mean: Average gas used.

  • sent_tx_unique_receivers: Number of different wallets they sent to.

  • tx_lifetime_days: How long they’ve been active.

  • tx_sent_received_ratio: Sent vs. received transaction ratio.

2. Token Transfer Stuff

Token patterns:

  • sent_token_unique_contracts: Different token types used.

  • token_usd_sent_received_ratio: Value sent vs. received.

  • token_diversity_ratio: How varied tokens are per transaction.

3. DEX Trading Moves

DEX behavior:

  • origin_swap_count: Number of swaps started.

  • dex_activity_ratio: How often they trade.

  • origin_swap_unique_tokens_in_out: Variety of swapped tokens.

4. Extra Cool Features

Extra Cool Features

  • Network Bits:

  • network_diversity: Total addresses they deal with.

  • address_interaction_density: How tight their network is.

  • activity_concentration: How focused their activity is.

  • Value Flow:

  • value_exchange_ratio: Sent vs. received value balance.

  • token_contracts_to_transactions_ratio: Token variety vs. activity.

  • Time Stuff:

  • activity_concentration: Spotting activity spikes.

  • Lifetime stats for different actions.

Model Setup

Trying Different Models

  • Random Forest: Good baseline, ranks features well.

  • Gradient Boosting: Catches tricky patterns step-by-step.

  • XGBoost: Fancy boosting with tweaks for uneven data.

  • LightGBM: Fast and handles categories like a champ.

:chart_increasing: What I Found

Sybil Behavior

  • Transactions:

  • Tons of transactions, short lifespan.

  • Cheap gas to save cash.

  • Fewer unique contacts.

  • Tokens:

  • Use just a few token types.

  • Weird value flows.

  • Fast token flips, like farming.

  • DEX Trading:

  • Trade in quick bursts.

  • Stick to certain token pairs.

  • Trade in tight time slots.

How I Built It

Data Pipeline


# My steps:

1. Loaded Ethereum and Base data.

2. Fixed labels with Ben2 help.

3. Made features.

4. Added fancy features.

5. Cleaned data.

6. Trained and validated model.

7. Predicted results.

Keeping It Solid

  • Missing Data: Filled with zeros or handled weird cases.

  • Bad Values: Swapped infinities, filled gaps.

  • Scaling: Tamed extreme values.

  • Cross-Chain: Mixed Ethereum and Base data smoothly.

How It Did

  • Validation AUC: Rocked the holdout data.

  • Feature Selection: Auto-picked the best features.

  • Generalization: Handled all address types well.

Wrapping Up

My Sybil detection model mixes ML with blockchain smarts to catch bad actors in Web3. With Ben2k’s label fixes and Ethereum/Base data, it’s a trusty tool to keep decentralized apps safe.

This thing’s good to go for Web3, blending tech chops with real-world use.

Sybil Detection with Human Passport and Octant

Author: debiao

Overview

It may be difficult to find the exact every sybil address, but it could be easy to find most of them. I will show you how to do it with nearly the simplest statistical method. Yes, only statistics, not machine/deep learning. TXs is all you need.

Methods

As an airdrop hunter, I have learned a lot from the ‘Alpha-Seeking KOLs’. To put it bluntly, most of them are sybils. Based on my observations, their onchain activities have some obvious characteristics. The most crucial point is the number of transactions, especially TXs on Ethereum mainnet. So my method is very simple. I just need to analyze the number of TXs of known sybil addresses to find statistical patterns.

The only data file I used is transactions.parquet. And as said before, I only care about Ethereum mainnet TXs. I calculated the number of TXs of every know sybil address through this file and then fit a normal distribution to it. The most important line of code in my method is as follows:

mu, std = norm.fit(eth_sybils_tx)

The following figure shows the result of plotting.

As this figure shows the distribution of the number of TXs of known sybil address, we just need to calculate the number of TXs of every test address and find its position in this distribution.

Conclusion

As of the time of writing this report, I received a high score of 0.8094 and ranked 8th. I admit that there may be some luck, and the limitations and upper limits of this method are also very obvious. However, it is still an interesting attempt and may provide inspiration for us to design more complex models.

Participant: Zephyr
Email: zephyrweb3@gmail.com

Sybil Address Detection Using On-Chain Behavioral Features

Overview

This project aims to build a machine learning model that predicts the probability of a wallet address being a Sybil, based on historical blockchain activity. A Sybil address typically exhibits behavior associated with manipulation, multi-wallet farming, or coordinated exploitation. To detect such patterns, we analyze both Ethereum and Base chains, utilizing multiple types of on-chain data.

Data Sources

We leverage five core datasets from both Ethereum and Base blockchains:

  • dex_swaps.parquet: Contains on-chain DEX trading data per transaction.
  • token_transfers.parquet: Captures ERC-20 token transfers.
  • transactions.parquet: General transaction metadata including gas and fees.
  • train_addresses.parquet: Labeled dataset of known Sybil (LABEL = 1) and non-Sybil (LABEL = 0) addresses.
  • test_addresses.parquet: Unlabeled addresses to score for Sybil probability.

These datasets are first merged across chains and then processed to extract features at the wallet address level.

Feature Engineering

We compute behavioral features for each address from three primary activity categories:

  1. Transaction Activity:
  • Number of transactions initiated.
  • Average and maximum transaction fees paid.
  • Duration of activity (days between first and last transaction).
  1. Token Transfer Behavior:
  • Total and average value of tokens sent and received.
  • Number of unique addresses interacted with (both sent to and received from).
  • Diversity of tokens transacted.
  1. DEX Swap Activity:
  • Count of swaps initiated.
  • Average USD value in and out per swap.
  • Number of unique platforms and token pairs used.

All features are aggregated using group-by operations on FROM_ADDRESS, TO_ADDRESS, or ORIGIN_FROM_ADDRESS, depending on the dataset.

Missing or infinite values are replaced with zero to ensure model stability.

Modeling Approach

We use a Random Forest Classifier for binary classification, predicting the probability of an address being a Sybil. The reasons for selecting Random Forest are:

  • Strong performance on tabular, imbalanced data.
  • Robustness to noisy or missing features.
  • Interpretability in terms of feature importance.

Model training includes:

  • Train/validation split (80/20).
  • Evaluation using ROC-AUC score.

Performance

The model achieves a Validation ROC-AUC of ~0.994, indicating strong discriminatory power between Sybil and non-Sybil addresses.

Scoring and Output

  • Test addresses are scored using the trained model.
  • Addresses without sufficient on-chain history for feature extraction are assigned a default score of 0.
  • Final output is saved in sybil_predictions.csv with two columns: ADDRESS, SCORE.

Limitations & Future Improvements

  • Feature extraction is based solely on observable behavior; Sybils with well-camouflaged activity may go undetected.
  • Model doesn’t incorporate graph-based or temporal sequence patterns, which could improve detection of coordinated activity.
  • Incorporating contract interactions, known farming events, or external Sybil lists may increase precision.

Sybil Detection with XGBoost for Octant Challenge

Username on Pond: hutchersonkeeland

EMAIL: hutchersonkeeland6062@gmail.com

Thanks a lot, Pond! I graduated with a degree in Computer Science and I am very happy to share my experience with you!

Overview

In the Octant Sybil analysis challenge, the goal was to predict sybil scores for wallet addresses based on transaction, token transfer, and DEX swap data. My approach leverages feature engineering and an XGBoost classifier to model the likelihood of an address being a sybil. Below, I detail my methodology, share key insights, and provide visualizations to illustrate the process.

Methodology

  • Data Loading and Preprocessing:
    • I loaded the provided datasets (tx_data, token_data, swap_data, train_set, test_set) using randomized file names to ensure reproducibility in a dynamic environment.
    • The target column (LABEL) in the training set was cleaned to ensure binary classification (0 for non-sybil, 1 for sybil). Invalid labels were removed, and the distribution was checked to confirm data quality.
  • Feature Engineering:
    • I extracted a variety of features from the three datasets to capture behavioral patterns of wallet addresses:
      • Transaction Features: Number of transactions, total ETH sent, average ETH per transaction, and number of distinct recipients.
      • Token Transfer Features: Number of token transfers, total USD value, and number of unique tokens.
      • DEX Swap Features: Number of swaps, total USD value, and number of unique tokens swapped.
      • Time-Based Features: Duration of activity (days active) and transaction frequency (transactions per day).
    • Missing values were filled with 0 to handle inactive addresses, ensuring robust feature sets for both training and test data.
  • Model Training:
    • I used an XGBoost classifier with the following hyperparameters:
      • n_estimators=150, learning_rate=0.05, max_depth=5, objective=‘binary:logistic’, eval_metric=‘auc’.
    • The data was split into 80% training and 20% validation sets, stratified to maintain label distribution.
    • The model was trained on the training set and evaluated on the validation set.
  • Prediction and Submission:
    • Features were extracted for the test set, and the trained model predicted sybil probabilities.
    • The submission file was saved as a CSV with address-probability pairs, using a randomized filename for consistency.

Key observations:

  • num_transactions and distinct_recipients were among the most important features, suggesting that sybil wallets may exhibit distinct transaction patterns.
  • token_usd_total and swap_usd_total also contributed significantly, indicating that high-value token activity could be a sybil indicator.

Code and Reproducibility

The full code is available in my Jupyter notebook, shared here: [link_to_notebook_if_uploaded]. The notebook includes data loading, feature extraction, model training, and prediction steps. I used pandas for data manipulation, scikit-learn for splitting data, and xgboost for modeling. The random seed was set to 123 for reproducibility.

Additional Insights

  • Challenges: Handling missing data for inactive addresses required careful imputation (using 0) to avoid bias. The randomized file names added complexity but ensured flexibility in data loading.
  • Potential Improvements: Incorporating network-based features (e.g., graph analysis of address interactions) or additional external datasets (e.g., on-chain reputation scores) could enhance performance.
  • Useful Resources: I found the feature engineering ideas from the previous competition write-ups (linked in the challenge description) particularly inspiring for crafting time-based and aggregation features.

Conclusion

My approach combined robust feature engineering with a well-tuned XGBoost model to predict sybil scores. The feature importance analysis provided interpretable insights into sybil behavior, which I hope benefits other participants.

Feel free to reach out with questions or suggestions!

Design and Implementation

AUTHOR:Candy

EMAIL:c1hanrongsan@outlook.com

1. Project Overview

This report details the design approach, implementation methods, challenges encountered, and solutions of our Sybil detection system. The system is based on real transaction data from Ethereum and Base chains, analyzing wallet address behavior patterns to build a robust prediction model that can effectively distinguish between normal users and Sybil attackers.

2. System Architecture

2.1 Data Structure

  1. Blockchain transaction data: Including transaction hash, sender address, receiver address, transaction value, gas usage, etc.
  2. Token transfer data: Recording ERC-20 token transfers, including sender, receiver, token contract address and transfer amount
  3. DEX exchange data: Recording token exchange activities on decentralized exchanges, including exchange tokens, amounts and related addresses

2.2 System Flow

The system workflow includes the following steps:

  1. Data loading and preprocessing: Reading transaction data from Ethereum and Base chains
  2. Feature engineering: Extracting and constructing key features for identifying Sybil addresses
  3. Model training: Training classification models using CatBoost algorithm
  4. Prediction and evaluation: Making Sybil probability predictions for unlabeled addresses and evaluating model performance

2.3 Multi-threading Architecture

For improving processing efficiency, the system adopts advanced multi-threading parallel computing architecture. This is the core optimization part of the system, significantly improving data processing speed and model training efficiency.

2.3.1 Multi-threading Design Principles

Blockchain data processing is a computation-intensive task, especially in the feature extraction stage. Our multi-threading architecture is based on the following principles:

  1. Task decomposition: Decomposing feature engineering into independent subtasks
  2. Resource balancing: Dynamically adjusting the number of threads based on CPU cores
  3. Synchronization control: Using Future pattern to manage dependencies between multi-threaded tasks
  4. Resource isolation: Ensuring data independence between threads, avoiding race conditions

2.3.2 Multi-threading Implementation

The system uses Python’s concurrent.futures library to implement multi-threading processing, mainly involving the following components:

# Pseudocode: Multi-threading feature generation system
def generate_features(eth_data, base_data, fn_addresses, n_jobs=-1):
    """Multi-threading feature engineering main function"""
    # Data preparation
    all_addresses = prepare_address_list(train_addresses, test_addresses)
    
    # Create thread pool - dynamically determine thread count
    with ThreadPoolExecutor(max_workers=n_jobs if n_jobs > 0 else None) as executor:
        # Submit three feature generation tasks in parallel
        tx_future = executor.submit(
            generate_transaction_features, 
            all_addresses.copy(), eth_data, base_data
        )
        
        token_future = executor.submit(
            generate_token_features, 
            all_addresses.copy(), eth_data, base_data
        )
        
        dex_future = executor.submit(
            generate_dex_features, 
            all_addresses.copy(), eth_data, base_data
        )
        
        # Wait for all tasks to complete and get results
        tx_features = tx_future.result()
        token_features = token_future.result()
        dex_features = dex_future.result()
    
    # Merge all feature subsets
    all_features = merge_feature_subsets(all_addresses, tx_features, 
                                         token_features, dex_features)
    
    return prepare_final_datasets(all_features, train_addresses, test_addresses)

2.3.3 Thread Coordination Mechanism

To ensure efficient collaboration between threads, we implemented the following coordination mechanisms:

  1. Task boundary definition:

    • Transaction features (generate_transaction_features)
    • Token transfer features (generate_token_features)
    • DEX exchange features (generate_dex_features)

    These three feature sets can be computed completely in parallel, without intermediate synchronization points.

  2. Data isolation and replication:

    # Create data copies for each thread to avoid shared state
    all_features_copy = all_features.copy()
    
  3. Future object monitoring:

    # Start multiple tasks simultaneously and monitor progress
    futures = []
    for feature_function in feature_functions:
        future = executor.submit(feature_function, data_copy)
        futures.append(future)
    
    # Process completed tasks
    for completed in as_completed(futures):
        result = completed.result()
        # Process results...
    
  4. Dynamic resource allocation:

    # Automatically detect CPU cores and allocate threads
    n_jobs = multiprocessing.cpu_count() 
    # Leave 1-2 cores for system processes
    working_threads = max(1, n_jobs - 2)
    

2.3.4 Multi-threading Performance Optimization

We adopted the following performance optimization techniques in our multi-threading implementation:

  1. Coarse-grained parallelization: Choose larger computation units for parallel processing to reduce thread synchronization overhead

  2. Data preloading: Preload required data before thread startup

  3. Memory optimization:

    # Example: Memory usage optimization
    def optimize_dataframe(df):
        # Reduce numerical precision
        for col in df.select_dtypes('float64').columns:
            df[col] = df[col].astype('float32')
        
        # Use category type for categorical columns
        for col in categorical_columns:
            df[col] = df[col].astype('category')
        
        return df
    
  4. Adaptive batching:

    # Automatically adjust batch size based on data scale
    def process_in_batches(addresses, batch_size=None):
        # If batch size not specified, calculate optimal batch size based on address count
        if batch_size is None:
            batch_size = min(10000, max(1000, len(addresses) // n_jobs))
        
        # Process in batches
        for i in range(0, len(addresses), batch_size):
            batch = addresses[i:i+batch_size]
            yield process_batch(batch)
    

2.3.5 CatBoost Model Training Multi-threading Optimization

In the model training stage, we also used multi-threading to improve efficiency:

# Pseudocode: Multi-threaded model training
def train_catboost_with_threading(X_train, y_train, X_test):
    # Configure CatBoost to use all available threads
    model = CatBoostClassifier(
        # Other parameters...
        thread_count=-1,  # Use all CPU cores
        task_type='CPU'   # Explicitly specify CPU parallelism
    )
    
    # Use thread-optimized data structures
    train_pool = Pool(
        X_train, 
        y_train,
        thread_count=-1  # Data loading also uses multi-threading
    )
    
    # Training process automatically utilizes multi-threading
    model.fit(train_pool)
    
    return model

2.3.6 Multi-threading Architecture Effect

We measured the performance improvement of the multi-threading architecture:

Processing Stage Single-thread Time Multi-thread Time (8 cores) Speedup Ratio
Feature Extraction 420s 68s 6.2×
Feature Engineering 185s 42s 4.4×
Model Training 320s 78s 4.1×
Total Processing Time 925s 188s 4.9×

These optimizations enable the system to efficiently process large-scale blockchain data, significantly reducing processing time.

3. Feature Engineering

3.1 Basic Features

We extracted rich basic features from three main data sources:

Transaction features:

Token transfer features:

DEX exchange features:

3.2 Advanced Features

Based on the basic features, we constructed a series of advanced features designed to capture behavioral differences between Sybil addresses and normal user addresses:

Pattern recognition features:

  • Transaction activity density: reflecting the concentration of address transaction activities
  • Token diversity score: measuring the richness of tokens interacted with by the address
  • Social network size: reflecting the breadth of interaction between addresses and other addresses
  • Value flow ratio: analyzing the balance of fund inflow and outflow of addresses
  • Behavior feature combinations: combining multiple basic indicators into composite pattern recognition features

We found that through these advanced features, we can effectively capture common behavioral patterns of Sybil addresses, such as short-term high-intensity activities, limited external interactions, and unnatural transaction patterns.

The specific calculation methods of these advanced features involve weighted combinations of basic features, ratio calculations and time window analysis, constituting the core discriminative ability of the model.

3.3 Feature Selection

To improve model performance, we implemented feature selection methods:

  • Variance detection: Removing constant or low-variance features
  • Feature importance screening: Training preliminary models and selecting feature subsets that contribute 90% importance
  • Preventing overfitting: Reducing model complexity through feature selection

4. Challenges and Solutions

Data Quality Issues

Challenge: Missing values, outliers, and inconsistent formats in the original data.

Solutions:

  • Implemented robust data cleaning process
  • Used RobustScaler to handle outliers
  • Standardized address format (uniformly converted to lowercase)
  • Applied quantile clipping for extreme values

Results

The multi-threading architecture provided a 4.9× speedup in total processing time, with feature extraction seeing the most significant improvement (6.2× faster).

The addition of multi-threading architecture significantly improved system performance, while feature selection enhanced model quality. This is the Top 15 Feature importances that I got.

The competition aimed to identify Sybil wallets by analyzing on-chain behavior across Ethereum and Base, using a large but weakly populated dataset. Throughout modeling, we discovered that transaction count bucketing significantly boosted AUC by localizing learning—though it struggled in low-sample segments. We also sourced external Sybil labels to enhance training quality and found that improperly parsed timestamps degraded temporal feature reliability, underscoring the need for clean, consistent time data.

Pond username: unchartedwatersfilm76
email:Unchartedwatersfilm76@gmail.com

:bar_chart: Phase 1: Data Exploration & Augmentation Summary

We began by inspecting the structure and quality of all datasets provided for both Base and Ethereum chains, which included:

  • train_addresses.parquet
  • test_addresses.parquet
  • transactions.parquet
  • token_transfers.parquet
  • dex_swaps.parquet

A dynamic inspection utility was built to load files, report shape, dtypes, missing values, and preview contents.

:white_check_mark: Key Findings (Base Chain):

  • train_addresses: 51,515 labeled addresses (Sybil vs. non-Sybil), no missing values.
  • test_addresses: 20,369 unlabeled addresses, clean for inference.
  • transactions: 2.1M rows, rich in gas, fee, and address details; missing values in MAX_FEE_PER_GAS and TO_ADDRESS.
  • token_transfers: 4.1M transfers; ~60% missing in AMOUNT_USD.
  • dex_swaps: 239K records; AMOUNT_IN/OUT_USD missing in 12–24%.

:white_check_mark: Ethereum Observations:

  • Similar structure, larger volumes (e.g., 500K+ DEX swaps).
  • Unique missing value patterns (e.g., ORIGIN_TO_ADDRESS in swaps).

:pushpin: Dataset Augmentation Using External Sybil Signals

:police_car_light: Motivation:

The original dataset was imbalanced (2.55% Sybil), risking poor recall and generalization. To address this, we utilized competition-permitted external Sybil lists.

:magnifying_glass_tilted_left: Sybil Address Sourcing:

  • Public lists from LayerZero and zkSync yielded 27,910 Sybil suspects.
  • We filtered to retain only those appearing in provided transactions, token_transfers, or dex_swaps (as FROM/ORIGIN addresses), resulting in 888 high-confidence Sybil addresses with feature coverage.

:puzzle_piece: Dataset Construction:

  • Merged Base and Ethereum train_addresses (standardized casing and deduplicated).
  • Final base training set: 99,067 addresses (2,528 Sybils, 96,539 non-Sybils).
  • Appended the 888 Sybil addresses (LABEL = 1), removed duplicates (preserving the Sybil label), and imputed missing labels as 0.
  • Final counts:
    • :white_check_mark: 3,416 Sybils
    • :white_check_mark: 96,528 Non-Sybils
    • :bar_chart: 99,944 total → Sybil rate improved from 2.55% → 3.42%

:file_folder: Artifacts Generated:

  • merged_train.parquet: unified Base + Ethereum training set
  • 888_sybil_addresses.csv: filtered Sybils with on-chain activity
  • Final labeled dataset (99,944 entries) for model training

:link: Cross-Chain Feature Aggregation: Base + Ethereum

To capture Sybil behavior across chains, we unified Base and Ethereum datasets into a single address-level feature table. This enabled modeling of multi-chain behavioral profiles—critical for identifying Sybils operating across siloed networks.

Why Cross-Chain?

Sybil actors often use multiple chains to evade detection. Merging data enriches the behavioral signal, helping the model learn generalized and nuanced Sybil patterns.

Step-by-Step Pipeline:

  1. Load + Normalize Address Sets
    Unified training (merged_train_with_888_sybil.csv) and test addresses from both chains, normalized to lowercase.
  2. Ingest Event Logs
    Loaded transactions, token_transfers, and dex_swaps from Base and Ethereum.
  3. Filter for Relevant Events
    Retained only rows involving addresses in the combined training/test set.
  4. Per-Chain Feature Extraction
    Extracted address-level stats (counts, values, diversity) per chain with prefixes (base_, eth_) for seamless merge.
  5. Merge Features
    Joined Base and Ethereum features on address and filled missing values with 0.
    Output: Unified feature matrix for training and inference.

Sample:
address, base_tx_out_count, eth_tx_in_count, …

:brain: Step 2: Graph-Based Token Transfer Features (Base & Ethereum)

We engineered graph-based features from token transfer logs to capture transactional dynamics and economic roles of each address.

Preprocessing

Address columns varied (ORIGIN_FROM_ADDRESS, FROM_ADDRESS, etc.), so we prioritized origin fields and normalized all addresses to lowercase.

Graph Features per Chain (4):

  • in_degree: number of times tokens were received
  • out_degree: number of times tokens were sent
  • total_received: sum of tokens received
  • total_sent: sum of tokens sent

Behavioral Insights:

  • High out_degree, low in_degree: faucet/distributor
  • High in_degree, low out_degree: aggregator
  • High degrees + zero-value sums: potential spam/Sybil flows

Base Extraction

  • Records: 4.18M
  • Senders: 101,953
  • Receivers: 17,453
  • Unique: 119,406
    → Strong skew toward send-only addresses—common in Sybil bots.

Ethereum Extraction

  • Records: 3.13M
  • Senders: 214,565
  • Receivers: 44,107
  • Unique: 258,672
    → Many gas-optimized send-only wallets—possible Sybil clusters.

Merge Across Chains

  • Outer-joined Base + Ethereum transfer metrics on address
  • Filled NAs with 0
  • Final size: 367,406 addresses × 9 features

Output saved to: /kaggle/working/graph_metrics.parquet
Sample: address, base_in_degree, eth_total_sent, …

These graph-based signatures capture interaction roles and are a key component in our Sybil detection architecture.

Phase 3: Token Transfer Behavior Features (with Origin Fallback)

We engineered behavioral features from token_transfers.parquet (Base + Ethereum). All address fields were normalized to lowercase. To accurately trace initiators, we used ORIGIN_FROM_ADDRESS and ORIGIN_TO_ADDRESS as fallbacks.

Feature Categories:

  1. Amount Uniformity
    For each sender:
  • amount_unique_vals: unique token amounts sent
  • amount_std: standard deviation of sent amounts
    → Low variance may indicate Sybil automation.
  1. Token Balance Flow
    For each address:
  • amount_sent, amount_received
  • out_in_ratio = sent / (received + 1)
    → Detects draining/funnel wallets.
  1. Token Variety
  • Count of distinct tokens sent/received
  • token_variety = tokens_sent + tokens_received
    → Low or high values indicate limited usage or airdrop farming.

Result:
Features were merged per address with chain-specific prefixes (base_, eth_).
Final shape: 367,522 addresses, 13 features, ~68 MB.

Step 4: Final Feature Integration & Model Training

Feature Consolidation:

We merged all chain-specific features into a single final_features DataFrame (41 columns, 126,347 addresses), normalized column casing, and merged it into:

  • train.csv: from (99,943, 30) → (99,943, 70)
  • test.csv: from (26,563, 29) → (26,563, 69)
    → Saved as step4_train_with_all_features.csv and step4_test_with_all_features.csv.

Model Training: LightGBM

  • Input:
    • X: 68 features (excluding ADDRESS, LABEL)
    • y: 99,943 labels
    • X_test: for inference
  • Train/Validation Split:
    • 85% train (84,951), 15% validation (14,992)
    • LightGBM trained with AUC = 0.9938
  • Cross-Validation:
    • 5-fold stratified CV
    • Average AUC = 0.9933, confirming generalization
  • Test Prediction:
    • Saved as test_predictions.csv with ADDRESS and PREDICTION


Key Takeaways

  • Behavioral token features (uniformity, flow, variety) and graph-based metrics were highly predictive.
  • Chain-specific consistency via base_ / eth_ prefixing enabled smooth integration.
  • Final model showed no overfitting, with validation and CV AUC both > 0.993.

Phase 5: Time-Based Feature Engineering Across Chains

We engineered temporal behavior features from Base and Ethereum transaction logs to detect Sybil wallets via activity frequency, regularity, and duration.

Methodology:
We defined a time_based_features function to extract, for each address (as both sender and receiver):

  • first_tx_time, last_tx_time, time_span
  • avg_tx_gap, hour_mode, weekday_mode

Function inputs:

  • tx_data: transaction DataFrame
  • address_list_path: CSV of all known addresses
  • prefix: “base” or “eth”

Code:
Applied to each chain:

base_time_features = time_based_features(base_tx, address_list_path, prefix=“base”)

eth_time_features = time_based_features(eth_tx, address_list_path, prefix=“eth”)

Execution Logs:
Base:

  • 126,347 addresses loaded
  • FROM matches: 1.91M | TO: 225K
  • Features created: FROM – 38,704 | TO – 26,797
  • Merged: 40,422 addresses

Ethereum:

  • 126,347 addresses loaded
  • FROM: 858K | TO: 382K
  • Features created: FROM – 44,930 | TO – 51,738
  • Merged: 54,224 addresses

Final Merge:
Joined Base + Ethereum time features on ADDRESS via outer join:
:bar_chart: merged_time_features.shape: (83,403, 25)

Sample Output:
Each row shows activity metrics across chains, e.g., base_time_span_from, eth_avg_tx_gap_to, etc.

Summary:
These 25 features capture wallet lifecycle, periodicity, and activity gaps — crucial for distinguishing Sybil behavior (bursty, short-lived) from organic activity. The result feeds into final training and analysis.

:white_check_mark: Phase: FIX Time-Based Feature Engineering

Objective: Extract address-level temporal behavior signals (e.g., span, gap, hour/day patterns) from transactions on Base and Ethereum to reveal Sybil coordination.

:puzzle_piece: Methodology

  1. Function: time_based_features() computed FROM/TO side features per address with chain prefixing.
  2. Scope: Filtered transactions to 126,347 known addresses (matching FROM_ADDRESS or TO_ADDRESS).
  3. Normalization: Timestamps converted to UTC and sorted.
  4. Features (FROM & TO):
  • First/last transaction time
  • Activity span (seconds)
  • Mean gap between transactions
  • Mode hour and weekday
  1. Merge & Cleanup: FROM/TO merged per address, filtered to knowns.

:bar_chart: Output Summary

Base:

  • FROM matches: 1.92M
  • TO matches: 225k
  • Unique addresses: 40,422

Ethereum:

  • FROM matches: 858k
  • TO matches: 382k
  • Unique addresses: 54,224

Merged:

  • Total addresses: 83,403
  • Total features: 25 time-based features

Integrated into final train/test sets:

  • Train: (99,943 × 118)
  • Test: (26,563 × 117)

:brain: Datetime Format Fix

Issue: LightGBM ignored string/object datetime features.
Fix: Converted all *_TIME / *_DATE columns to UNIX timestamps via preprocess_fixed().

  • Handles datetime parsing, numeric conversion, and NaN filling
  • :white_check_mark: Result: 116 usable columns

:package: Final Pipeline

  1. Reloaded Step 5 features
  2. Preprocessed with preprocess_fixed()
  3. Trained LightGBM with 15% validation split

Validation AUC: 0.9955
Confusion Matrix:

[[14431 49]

[ 89 423]]

Classification Report:

Metric Non-Sybil Sybil
Precision 0.9939 0.8962
Recall 0.9966 0.8262
F1-score 0.9952 0.8598

:white_check_mark: High Sybil precision = low false positives

  • :warning: Slightly lower recall = tuning opportunity

:repeat_button: 5-Fold Stratified CV

  • Performed with StratifiedKFold(n_splits=5)
  • Avg AUC: ~0.9947
  • Confirms strong generalization despite class imbalance

:pushpin: Takeaways

  • Proper datetime formatting unlocked critical time behavior signals
  • LightGBM + fixed preprocessing → robust Sybil classifier
  • Ready to pursue stacking, threshold tuning, or graph-informed boosts

:bullseye: Transaction Count Bucketing for Sybil Detection

:brain: Motivation

Initial models struggled due to skewed transaction volumes—non-Sybils rarely exceeded 50 transactions, while some Sybils surpassed 1,000. This imbalance hurt generalization, especially for high-activity wallets. We hypothesized that training separate models by transaction count buckets would improve precision by isolating behavior within activity tiers.


:gear: Feature Engineering

We computed total transactions per address on both Base and Ethereum:

df[“eth_total_tx_count”] = df[“ETH_TX_IN_COUNT”] + df[“ETH_TX_OUT_COUNT”]

df[“base_total_tx_count”] = df[“BASE_TX_IN_COUNT”] + df[“BASE_TX_OUT_COUNT”]

Then grouped them into defined ranges:

bins = [0, 10, 100, 500, 1000, 5000, float(“inf”)]

labels = [“0–10”, “11–100”, “101–500”, “501–1000”, “1001–5000”, “>5000”]

df[“eth_tx_bucket”] = pd.cut(df[“eth_total_tx_count”], bins=bins, labels=labels)

df[“base_tx_bucket”] = pd.cut(df[“base_total_tx_count”], bins=bins, labels=labels)


:test_tube: Per-Bucket Modeling Strategy

We trained one LightGBM model per bucket (excluding those with insufficient samples). Each dataset was filtered by bucket, missing values handled, categorical data encoded, and models validated using AUC:

if len(bucket_df) < 100: continue # Skip underpopulated buckets

X = bucket_df[feature_cols]; y = bucket_df[“LABEL”]

Encode, fill, split, train, evaluate…

:chart_increasing: Results

Bucket Wallets AUC
0–10 26,202 0.9478
11–100 35,712 0.9681
101–500 8,951 0.9739
501–1000 1,411 0.9603
1001–5000 822 0.9512
>5000 137 Skipped

Moderately sized buckets—especially 101–500—achieved the highest AUCs, offering a balance between behavioral richness and sample size. Some behavioral buckets revealed nearly all Sybils, making them highly predictive.

:white_check_mark: Conclusion

Bucketing addresses by transaction activity was a pivotal shift in our modeling strategy. It enabled localized learning, improved precision, and uncovered new behavioral patterns specific to high-activity Sybils. However, the technique’s effectiveness was strongly tied to bucket population: models only performed well when trained on a sufficient number of examples.

:chart_increasing: Final Model Training after Timestamp Fix & Sybil Pattern Analysis

:counterclockwise_arrows_button: Motivation & Fixes

Temporal inconsistencies in timestamp-based features—critical for spotting subtle Sybil behaviors—led us to re-parse all timestamps using pd.to_datetime, normalize timezones, and fix NaNs in derived metrics like transaction span and average gap. We saved the cleaned dataset as train_with_fixed_timestamps_full.csv, which also included corrected features such as hour mode and weekday mode.

:test_tube: LightGBM Training Pipeline

Using the cleaned data, we trained a LightGBM classifier with 5-fold Stratified Cross-Validation to preserve label balance.

  • Preprocessing:
    • Dropped raw timestamps and ID columns
    • Retained only numerical features
  • Model Configuration:
    • objective=‘binary’, metric=‘auc’, boosting=‘gbdt’
    • learning_rate=0.01, num_leaves=64
    • Early stopping: 200 rounds
    • Subsampling for rows/columns
  • Validation:
    • AUC tracked per fold, best model saved
Fold AUC
1 0.99581 :white_check_mark:
2 0.99502
3 0.99407
4 0.99556
5 0.99257

Mean AUC: 0.99461 Std Dev: ±0.00118 Best Model: lgb_fold1.pkl

:bar_chart: Feature Importance Highlights

The top 40 features (based on importance_type=“gain”) revealed that Sybil detection relies heavily on behavioral, temporal, and graph-based signals. Key contributors included:

  • eth_txn_avg_gap_seconds
  • eth_txn_hour_mode
  • eth_transfer_amount_std
  • base_contract_interaction_count
  • eth_graph_cluster_id
  • eth_total_internal_txns

These confirmed that temporal regularity, usage patterns, and network position are critical signals for identifying Sybil behavior.

:three_o_clock: TIME FEATURES

1. ETH_AVG_TX_GAP_FROM_x

  • Behavioral Insight: Sybil wallets show significantly longer average gaps between transactions, with a mean over 7x higher than non-Sybils.
  • Interpretation: Sybil addresses may exhibit infrequent or batched activity, likely due to script-driven patterns or paused activity between farming tasks.
  • Detection Value: High — strong temporal separation is a clear flag.

2. ETH_TIME_SPAN_FROM_x / ETH_TIME_SPAN_FROM_y

3. BASE_HOUR_MODE_FROM_x

  • Behavioral Insight: Sybil wallets show activity clustered at specific hours, with higher variability.
  • Interpretation: This supports the idea of scripted or batch interactions at off-peak times, possibly to avoid detection.
  • Detection Value: Medium — time-of-day mode can flag automation.

:puzzle_piece: INTERACTION GRAPH FEATURES

4. ETH_TX_OUT_UNIQUE_RECEIVERS

  • Behavioral Insight: Sybils interact with significantly more unique receivers (mean ~7.7 vs. 0.7).
  • Interpretation: Suggests broadcast behavior, spraying funds across addresses, often to obfuscate or distribute rewards.
  • Detection Value: Very High — strong evidence of networked behavior.

5. ETH_OUT_DEGREE

  • Behavioral Insight: Higher out-degree for Sybils (mean 8.7 vs. 2.8), though with much larger variance.
  • Interpretation: Indicates Sybil wallets often initiate interactions across more targets in the transaction graph.
  • Detection Value: High — higher connectivity is a red flag, though variance is high.

6. ETH_NUM_UNIQUE_CONTRACTS

  • Behavioral Insight: Sybil addresses interact with more contracts (mean 4.3 vs. 1.0).
  • Interpretation: Could suggest airdrop farming across protocols, repeatedly interacting with different contracts.
  • Detection Value: High — diversity of contract use is telling.

:money_with_wings: TRANSFER FEATURES

7. ETH_TF_OUT_AVG_AMOUNT

  • Behavioral Insight: Sybil values are notably smaller and consistent, despite skewed units — Non-Sybils show astronomically large averages (due to outliers).
  • Interpretation: Suggests Sybils typically move small amounts repeatedly, possibly to simulate legitimate usage or evade thresholds.
  • Detection Value: Medium-High — unit scaling is needed, but pattern is informative.

8. ETH_TF_OUT_COUNT

  • Behavioral Insight: Sybil wallets have higher transfer-out frequency (mean 8.5 vs. 2.8).
  • Interpretation: Regular token movements out may reflect token farming, draining, or scripted reward flows.
  • Detection Value: High — frequent output is typical of extraction behavior.

9. ETH_TX_OUT_VALUE

  • Behavioral Insight: Slightly higher for Sybils (6.6 vs. 3.9), but less dramatically.
  • Interpretation: Transaction values are marginally higher — Sybils may perform multiple low-value extractions.
  • Detection Value: Moderate — low signal without context.

10. base_total_tx_count

  • Behavioral Insight: Huge gap — Sybils: 27.7 avg vs. 1.4 for non-Sybils. A 20x difference
  • Interpretation: High activity on Base is a clear pattern of Sybils spamming transactions for activity thresholds or to blend in.
  • Detection Value: Very High — activity burst is a direct behavioral fingerprint.

11. eth_total_tx_count

  • Behavioral Insight: Sybils again dominate (22.0 vs. 3.3).
  • Interpretation: Similar to Base — aggressive interaction rate across multiple chains is common in Sybil attacks.
  • Detection Value: Very High — multi-chain spamming is common in incentive manipulation.

12. ETH_TOTAL_SENT

  • Behavioral Insight: Mean value higher in non-Sybils (due to extreme outliers), but IQR is tighter and higher for Sybils.
  • Interpretation: Suggests small-to-medium consistent outflows from Sybils, vs. rare huge transfers in real users.
  • Detection Value: Moderate — use IQR or log scale to normalize and improve insight.

13. BASE_TX_OUT_VALUE

  • Behavioral Insight: Sybils send more on average (1.39 vs. 0.07), but most non-Sybils have 0.
  • Interpretation: Sybils simulate active transfer behavior on Base to qualify for criteria.
  • Detection Value: High — any value vs. 0 is a key discriminant.

14. ETH_TX_OUT_MAX_VALUE

  • Behavioral Insight: Slightly higher max for Sybils (1.7 vs. 1.2), but with tight IQR.
  • Interpretation: Even max values are fairly small — supports idea of spamming low-to-mid-value interactions.
  • Detection Value: Moderate — contributes more as a supporting feature.

:brain: OVERALL BEHAVIORAL PROFILE: SYBILS

Trait Sybil Behavior
Time Long-lived, bursty, often batched hourly
Transfers Many small transfers, frequent activity, outflows
Interactions Broad connectivity, many receivers/contracts
Activity High transaction counts across chains
Amounts Mid-to-low amounts, rarely extreme

:white_check_mark: Key Detection Levers

  1. ETH_AVG_TX_GAP_FROM_x – Big gap = suspicious (script gaps).
  2. ETH_TX_OUT_UNIQUE_RECEIVERS / ETH_OUT_DEGREE – Spray behavior = high suspicion.
  3. base_total_tx_count / eth_total_tx_count – Excessive activity = likely Sybil.
  4. ETH_NUM_UNIQUE_CONTRACTS – Many contracts = likely farmer.
  5. BASE_TX_OUT_VALUE / ETH_TF_OUT_COUNT – Active drain patterns.
  6. ETH_TIME_SPAN_FROM_x – 0 span = inactive user (non-Sybil), long span = suspicious.

IQR Anomalies & Compression Signatures

Across Multiple Features:

  • Non-Sybil IQRs often collapse to (0.0, 0.0), suggesting many are dormant or inactive (i.e., passive recipients).
  • Sybil IQRs are consistently wider, showing broader behavioral expression (intentionally or through multi-role activity).

Interpretation:

  • Non-Sybils are either very new, very old (inactive), or unengaged.
  • Sybils occupy a middle zone of strategically feigned engagement.

pond name: ewohirojuso

ewohirojuso66@gmail.com

Introduction

This project focuses on detecting fake accounts (Sybil) on blockchain networks using machine learning. Basically, we need to identify those batch-registered accounts that are used for airdrop farming and prevent them from gaining unfair advantages in Web3 projects.

Project Overview

We were given approximately 2,500 known Sybil addresses for training, and need to predict whether 10,000 unknown addresses are Sybil or not. The data comes from transaction records, token transfers, and DEX trading data on Ethereum and Base chains.

Data Processing

Data Structure

Two main folders contain the datasets:

  • ethereum_sybil_detection/ - Ethereum chain data
  • base_sybil_detection/ - Base chain data

Each folder contains 5 parquet files:

  • train_addresses.parquet - Training addresses with labels
  • test_addresses.parquet - Test addresses
  • transactions.parquet - Regular transaction records
  • token_transfers.parquet - Token transfer records
  • dex_swaps.parquet - DEX swap records

Special Handling of False Negative Data

The most special part of this project is the integration of an additional data source: false_negatives_Ben2k.csv. This is a false negative dataset provided by Ben2k, containing addresses that were incorrectly classified as non-Sybil but are actually Sybil addresses.

Data Import Processing

def import_false_negatives(file_path):
    fn_data = pd.read_csv(file_path)
    # Standardize column names, supporting different formats like Address/address/ADDRESS
    if 'Address' in fn_data.columns:
        fn_data = fn_data.rename(columns={'Address': 'ADDRESS'})
    elif 'address' in fn_data.columns:
        fn_data = fn_data.rename(columns={'address': 'ADDRESS'})
    
    # Ensure consistent address format, remove whitespaces
    fn_data['ADDRESS'] = fn_data['ADDRESS'].str.strip()
    return fn_data

Label Update Mechanism

The most critical part is the update_training_labels function, which dynamically updates training set labels:

def update_training_labels(training_data, false_negatives):
    # Record original label distribution
    original_dist = training_data['LABEL'].value_counts().to_dict()
    print(f"Original label distribution: {original_dist}")
    
    # Convert to uppercase for case-insensitive comparison
    training_data['ADDR_UPPER'] = training_data['ADDRESS'].str.upper()
    false_negatives['ADDR_UPPER'] = false_negatives['ADDRESS'].str.upper()
    
    # Find matching address indices
    fn_addr_set = set(false_negatives['ADDR_UPPER'])
    matches = training_data[training_data['ADDR_UPPER'].isin(fn_addr_set)].index
    
    if len(matches) > 0:
        # Record original labels for statistics
        orig_labels = training_data.loc[matches, 'LABEL'].copy()
        # Update to Sybil label (1)
        training_data.loc[matches, 'LABEL'] = 1
        # Calculate actual changes
        changed = (training_data.loc[matches, 'LABEL'] != orig_labels).sum()
        print(f"Updated {changed} labels from non-Sybil to Sybil")

This processing is important because:

  1. Improves data quality: Corrects errors in original annotations
  2. Reduces noise: Prevents model from learning incorrect patterns
  3. Enhances performance: More accurate training data usually leads to better model performance

Technical Details of Address Matching

The code handles many details to ensure accurate address matching:

  • Case-insensitive: Unified conversion to uppercase for comparison
  • Whitespace handling: Uses str.strip() to remove leading/trailing spaces
  • Column name compatibility: Supports different column name formats (Address/address/ADDRESS)
  • Index operations: Uses DataFrame indices for efficient batch updates

Timestamp Standardization

The code standardizes all time-related fields uniformly:

if 'BLOCK_TIMESTAMP' in all_txs.columns:
    all_txs['BLOCK_TIMESTAMP'] = pd.to_datetime(all_txs['BLOCK_TIMESTAMP'])

This ensures consistency across different data sources and prevents calculation errors.

Feature Engineering

Transaction Feature Extraction

Combined data from both chains, adding chain identifiers to each transaction:

eth_txs['chain'] = 'ethereum'
base_txs['chain'] = 'base'
all_txs = pd.concat([eth_txs, base_txs], ignore_index=True)

Main extracted features include:

  • Sent transactions: count, total amount, average amount, fees, gas usage, etc.
  • Received transactions: count, total amount, number of senders, etc.
  • Cross-chain behavior: transaction ratios on different chains

Token and DEX Features

Similarly processed token transfer and DEX swap data to extract relevant statistical features.

Time Feature Processing

This part is quite complex, using the compute_time_features function to calculate account lifecycle features:

  • Account age (last activity time - earliest activity time)
  • Days inactive (current time - last activity time)
  • Duration of various activity types

Most importantly, all datetime columns are deleted at the end, keeping only numerical derived features to ensure clean model input.

Model Training

Chose LightGBM with main parameters:

Used 5-fold cross-validation and set class weights based on positive/negative sample ratios to handle data imbalance.

Feature Importance Analysis

Based on the feature importance chart from training, the most important features are:

  1. days_inactive - Days since last activity, far exceeding other features in importance
  2. account_age_days - Account age
  3. sent_gas_mean - Average gas usage
  4. sent_tx_fee_sum - Total transaction fees
  5. token_activity_density - Token activity density

Key Findings:

  • Time features are most important: Top two are time-related, indicating Sybil accounts have distinct temporal behavior patterns
  • Gas usage reveals automation: Average gas usage ranks third; scripted operations tend to have consistent gas usage
  • Economic behavior has characteristics: Transaction fees and token activity are also important

From the chart, we can see that days_inactive has a cliff-like lead in importance, likely because many Sybil accounts follow a “use and abandon” pattern.

Data Preprocessing

The code includes comprehensive preprocessing:

  • Outlier handling: Clipping extreme values using 99.9% quantile
  • Missing value imputation: Uniform filling with -1
  • Data type checking: Ensuring all features are numerical
  • Infinite value handling: Replacing inf and -inf with finite values

Summary

The biggest highlight of this project is the handling of false negative data. By using Ben2k’s additional data to correct training labels, this approach is rare but valuable in real machine learning projects. From the feature importance analysis, temporal behavior is indeed the key factor in distinguishing Sybil from normal users.

Sybil Wallet Detection System

my name: X_FOR_X

x4xingxiang@outlook.com

My Code’s Core Component Design

DataLoader

Goal: Data Integration

Core Functions:

  • Multi-chain Data Unification: Automatically identifies and loads parquet format data files from Ethereum and Base chains
  • False Negative Data Integration: Specifically handles the false_negatives_Ben2k.csv file (a new file added later by Pond officials), automatically identifies address columns and performs label correction

Technical Implementation:

@staticmethod
def load_chain_data(data_path):
    """Load data from a single chain"""
    datasets = {}
    files = ['train_addresses', 'test_addresses', 'transactions', 'token_transfers', 'dex_swaps']
    
    for filename in files:
        filepath = data_path / f'{filename}.parquet'
        if filepath.exists():
            datasets[filename] = pd.read_parquet(filepath)
            print(f"Loaded {filename}: {len(datasets[filename])} rows")

FeatureEngine

Design Philosophy: Convert complex blockchain data into feature vectors usable by machine learning

Core Modules:

  1. Safe Data Type Converter

    • safe_numeric(): Safely converts arbitrary data to numeric types
    • safe_datetime(): Unifies timestamp formats, handles different time representations
  2. Transaction Behavior Feature Extraction

    def build_transaction_metrics(self, addresses, eth_data, base_data):
        """Build transaction-related metrics"""
        # Merge multi-chain data
        # Calculate sender aggregation features: transaction count, amount statistics, Gas usage patterns
        # Calculate receiver features: received transaction statistics, sender diversity
        # Generate network preference features: usage tendencies across different chains
    
  3. Token Transfer Feature Extraction

    • Token diversity analysis: contract count and token type statistics
    • Major token usage patterns: trading behaviors for WETH, USDC, USDT, DAI
    • Value flow analysis: USD value distribution and flow patterns
    • Time pattern recognition: temporal features of token activities
  4. DEX Trading Feature Extraction

    • Trading efficiency calculation: input-output amount ratio analysis
    • Platform usage preferences: usage patterns across different DEX platforms and liquidity pools
    • Trading strategy identification: patterns in trade size, frequency, and token selection
  5. Composite Feature Generator

    def create_combined_features(self, tx_features, token_features, dex_features):
        """Create composite features"""
        # Activity complexity: complexity of cross-type transaction activities
        # Value flow: overall fund flow scale and patterns
        # Time aggregation: temporal correlations across different activity types
    

Feature Processing Strategies:

  • Temporal Feature Numerization: Convert all timestamps to relative days to avoid object type errors
  • Missing Value Strategy: Use -1 filling to let the model automatically learn the meaning of missing patterns
  • Feature Engineering Validation: Automatically check the data types and value ranges of generated features

ModelOptimizer

Design Philosophy: Automate model training and optimization processes to ensure optimal performance

Core Functions:

  1. Intelligent Hyperparameter Optimization

    def optimization_objective(self, trial, X, y):
        # Use Optuna TPE algorithm for efficient search
        # Streamlined parameter space, focusing on key hyperparameters
        # Fast cross-validation evaluation of candidate parameters
    
  2. Stratified Cross-Validation

    • 3-fold stratified cross-validation ensures training stability
    • Automatically handles class imbalance issues
    • Generates OOF (Out-of-Fold) predictions for model evaluation
  3. Feature Importance Analysis

    • Automatically calculates and ranks feature importance
    • Provides business-interpretable feature analysis reports
    • Supports feature selection and model optimization decisions

Optimization Strategies:

  • Class Balance: Automatically calculates positive-negative sample weights through scale_pos_weight
  • Early Stopping Mechanism: Prevents overfitting by stopping training when validation performance no longer improves
  • Model Ensemble: Generates averaged predictions from multiple models through cross-validation

Experimental Results

Model Performance

  • Cross-validation AUC: 0.998122 (near-perfect classification)
  • Accuracy: 99%
  • Sybil Detection Recall: 95% (correctly identified 2464 out of 2585 Sybils)
  • Sybil Detection Precision: 81% (81% of addresses predicted as Sybil are actually Sybil)

Confusion Matrix Analysis

              Predicted
Actual    Normal    Sybil
Normal    95921     561    (False positive rate: 0.58%)
Sybil      121     2464    (False negative rate: 4.68%)

Future Outlook

My idea is that in the future, we can consider integrating more on-chain data sources to further enhance the system’s detection capabilities and application value. Hope this is helpful to you by:
Prevents Sybil accounts from manipulating DAO voting results through numerous fake identities…
Ensures governance decisions reflect genuine community will rather than attacker manipulation…
Improves community trust and participation enthusiasm in governance systems…

Hi, I was wondering if you noticed any significant difference between your local cross-validation score and the leaderboard score. It seems like there is a distribution shift between the train and test sets. I’d really appreciate your thoughts or feedback on this. Thanks in advance!

Sybil detection with Catboost

Participant: gespsy
Email: vasilyabc@gmail.com

Abstract

This article presents techniques for training a CatBoost model to detect anomalies in labeled datasets with a strong class imbalance, where anomalies are significantly underrepresented in the training data. In this context, the anomalies are sybils. The paper discusses the development of a baseline model, feature engineering strategies, and hyperparameter optimization using Optuna.

Introduction

The initial dataset consisted of information about transactions and swaps on decentralized exchanges (DEXs) across the Base and Ethereum networks. At the outset, I hypothesized that since user activity takes place on different networks, anomalous behavior might manifest differently in each one. Based on this assumption, I trained two separate models for each network and then combined their predictions using a meta-model to generate the final output. However, this approach did not yield the expected results. In practice, the best performance was achieved by training a single model using features derived from both networks.

In addition to CatBoost, I experimented with individual models and ensemble methods from the PyOD library for anomaly detection. However, their performance was significantly inferior to that of CatBoost, so they are not discussed further in this article.

I also explored dimensionality reduction using PCA and addressed class imbalance with SMOTE-based oversampling. Nevertheless, neither approach led to any performance improvements, and therefore they are not covered in detail in this paper.

Metric Selection

The task required accurate probability estimation, and the primary evaluation metric was ROC-AUC. However, for model comparison and hyperparameter tuning, I primarily relied on the log-loss metric. Log-loss provides a more precise assessment of the predicted probabilities, especially in scenarios with severe class imbalance. In such cases, ROC-AUC can often approach or even reach 1.0, despite the model performing poorly in identifying anomalies. Therefore, log-loss was a more reliable indicator of model quality in this context.

Feature Extraction

For wallet addresses on both the Base and Ethereum networks, the following features were extracted:

  • n_swaps — number of unique swaps based on transaction hash
  • swap_volume_in — total volume (in USD) of tokens received through swaps
  • swap_volume_out — total volume (in USD) of tokens sent through swaps
  • n_unique_tokens_in — number of unique tokens received through swaps
  • n_unique_tokens_out — number of unique tokens sent through swaps
  • transfer_sent_count — number of unique outgoing transfers based on transaction hash
  • transfer_sent_amount_usd — total volume (in USD) of outgoing transfers
  • transfer_received_count — number of unique incoming transfers based on transaction hash
  • transfer_received_amount — total volume (in USD) of incoming transfers
  • n_transactions — total number of transactions
  • total_gas_used — total gas spent on transactions
  • total_gas_limit — total gas limit across all transactions
  • avg_gas_price — average gas price
  • total_tx_value — total value of all transactions
  • activity_span_days — number of days with recorded swap activity
  • transfer_balance_usd — difference between USD volume sent and received via transfers
  • transfer_activity_ratio — ratio of incoming to outgoing transfer counts (outgoing transfer counts always ≥ 1)
  • gas_efficiency — ratio of total gas used to total gas limit

Pearson Correlation

After calculating the Pearson correlation coefficient for each pair of features, highly correlated features (correlation > 0.95) were removed from the dataset. It is important to note that only features with strong positive correlation were excluded. Removing features with negative correlation led to a decrease in model performance.

As a result, the following features were removed from the dataset:

  • swap_volume_out_base
  • n_unique_tokens_out_base
  • transfer_received_count_base
  • transfer_received_amount_usd_base
  • swap_volume_out_eth
  • n_unique_tokens_out_eth
  • transfer_received_count_eth

Model Training and Hyperparameter Optimization

When training a CatBoost classification model on a highly imbalanced dataset, it is crucial to set the auto_class_weights parameter to appropriately account for the underrepresented class.

Hyperparameter tuning was performed using Optuna, optimizing the following parameters:

  • iterations
  • learning_rate
  • depth
  • l2_leaf_reg
  • border_count
  • min_data_in_leaf
  • grow_policy
  • loss_function
  • eval_metric
  • task_type
  • random_seed (the model was run with different random seeds)
  • bootstrap_type
  • subsample
  • bagging_temperature

Below is the ROC curve of the trained model:

Feature Importance

In the training data, there were significantly more addresses from the Ethereum network compared to the Base network. When merging the datasets, this imbalance led to many Base-related features being filled with zeros, as not all Ethereum addresses were present in the Base network.

The feature importance plot clearly shows that the model distinguishes between features from the two networks. Most Ethereum-related features appear at the top of the importance ranking, while Base-related features follow lower in the list.

Interestingly, the model identified gas-related features and the transfer_activity_ratio (the ratio of incoming to outgoing transactions) as the most informative for both networks. This suggests that transaction behavior and gas usage are key indicators for detecting anomalies across different blockchain networks.

Conclusion

This study demonstrates the effectiveness of using CatBoost for anomaly detection in blockchain transaction data with a highly imbalanced class distribution. Despite initial assumptions about the benefits of training separate models for different networks, the best performance was achieved by training a single model on combined features from both Ethereum and Base.

Feature engineering and correlation filtering played a crucial role in improving model performance and reducing redundancy. Hyperparameter tuning with Optuna further enhanced the model’s predictive capabilities, and log-loss proved to be a more reliable metric for model selection than ROC-AUC under strong class imbalance.

The feature importance analysis revealed that gas-related metrics and the transfer_activity_ratio were among the most significant indicators of anomalous behavior, regardless of the network. This insight could be valuable for future research and practical applications in blockchain security and fraud detection.

Sybil Detection with Human Passport and Octant

Participant: Mahboob Biswas

Email : mahboobbiswas@gmail.com

Contact : +91 7029232633

Date: May 28, 2025

Overview

Sybil attacks have long been a challenge in Web3, affecting everything from airdrops and governance to funding mechanisms. These attacks occur when individuals create multiple fake identities to manipulate systems, gain unfair advantages, or exploit incentives.

Human Passport by Holonym, Octant and the Ethereum Foundation are tackling this head-on by sponsoring a Sybil detection competition, where participants will build models on behaviors of known Sybil and normal addresses to predict Sybil scores of wallets.

Objective

The objective is to build a machine learning model that predicts the probability of a given wallet address being a sybil, using historical blockchain data.

How you process the data is entirely up to you—feature engineering, model selection, and optimization are in your hands. We will be using a private database of known Sybil and human wallets so you can use any trick up your sleeve to improve the score of your model.

Model Output

For a given address, the desired output of the model is a score between 0 and 1 (0=non-Sybil, 1=Sybil) indicating how likely the given address is a Sybil wallet.

1. Data Loading and Structure

The dataset is divided into two chains: Base and Ethereum. Each chain provides the following files:

  • train_addresses.parquet: Contains wallet addresses and their labels (0 for non-Sybil, 1 for Sybil).
  • test_addresses.parquet: Contains wallet addresses for which predictions are required.
  • transactions.parquet: Includes transaction details such as block number, timestamp, sender/receiver addresses, gas used, and transaction fees.
  • token_transfers.parquet: Records token transfer events, including sender, receiver, amount, and token details.
  • dex_swaps.parquet: Captures DEX swap events, including amounts, tokens, and pool information.

Key Observations:

  • Train Addresses: The training dataset includes labeled addresses, enabling supervised learning.
  • Test Addresses: Contains 20,369 unique addresses across both chains for prediction.
  • Transactions: Includes fields like FROM_ADDRESS, TO_ADDRESS, VALUE, GAS_USED, and TX_FEE.
  • Token Transfers: Provides FROM_ADDRESS, TO_ADDRESS, AMOUNT, and SYMBOL.
  • DEX Swaps: Includes SENDER, AMOUNT_IN, AMOUNT_OUT, TOKEN_IN, and TOKEN_OUT.

The datasets were loaded using pandas.read_parquet for efficient handling of large parquet files. Initial exploration confirmed no missing critical fields, but feature engineering was necessary to derive meaningful predictors.

2: Data Loading and Exploratory Data Analysis (EDA)

2.1 Label Distribution in Training Data

The training data exhibits a significant class imbalance, critical for model design:

  • Base:
    • LABEL 0.0 (non-Sybil): 97.059109%
    • LABEL 1.0 (Sybil): 2.940891%
  • Ethereum:
    • LABEL 0.0 (non-Sybil): 95.20771%
    • LABEL 1.0 (Sybil): 4.79229%

This imbalance suggests the need for techniques like class weighting or adjusted thresholds to prioritize Sybil detection (high recall).

2.2 Transaction Patterns

Transaction data was analyzed for usability:

  • Base:
    • Original count: 2,333,362
    • Valid records (after filtering invalid values): 2,323,798
    • Percentage retained: 99.59%
  • Ethereum:
    • Original count: 1,554,930
    • Valid records: 1,554,678
    • Percentage retained: 99.98%

Nearly all transaction data is usable, indicating high data quality.

2.3 Token Transfers

Token transfer data showed varying retention rates after cleaning:

  • Base:
    • Original records: 4,517,682
    • Clean records: 1,690,300
    • Percentage retained: 37.42%
  • Ethereum:
    • Original records: 3,496,171
    • Clean records: 2,544,354
    • Percentage retained: 72.78%

The significant drop in Base data suggests more missing or invalid entries compared to Ethereum.

2.4 DEX Swaps

DEX swap data was filtered for valid USD amounts:

  • Base:

    • Original records: 239,020
    • Clean AMOUNT_IN_USD: 179,949 (75.29%)
    • Clean AMOUNT_OUT_USD: 169,758 (71.02%)
  • Ethereum:

    • Original records: 588,606
    • Clean AMOUNT_IN_USD: 523,891 (89.01%)
    • Clean AMOUNT_OUT_USD: 513,147 (87.18%)
  • Ethereum retains a higher proportion of clean records, likely due to better data consistency.

3. Feature Engineering

Feature engineering was critical to transform raw blockchain data into predictive features. The prepare_data_for_xgboost function (not shown in the provided code but referenced) was used to create features. Below are the likely features engineered based on the dataset structure:

3.1 Transaction-Based Features

  • Transaction Count: Number of transactions per address.
  • Average Gas Used: Mean gas used across transactions.
  • Total Transaction Value: Sum of transaction values (in native currency).
  • Transaction Frequency: Number of transactions per unit time.
  • Unique Counterparties: Number of unique TO_ADDRESS or FROM_ADDRESS.

3.2 Token Transfer Features

  • Transfer Count: Number of token transfers per address.
  • Unique Tokens: Number of distinct tokens transferred.
  • Average Transfer Amount: Mean transfer amount (in USD or native units).
  • Transfer Velocity: Frequency of transfers over time.

3.3 DEX Swap Features

  • Swap Count: Number of DEX swaps per address.
  • Average Swap Amount: Mean swap amount (in USD).
  • Unique Token Pairs: Number of distinct token pairs swapped.
  • Swap Frequency: Swaps per unit time.

3.4 Temporal Features

  • Account Age: Time between the first and last transaction.
  • Activity Periods: Number of active days or blocks.
  • Transaction Recency: Time since the last transaction.

3.5 Handling Multi-Chain Data

Since the dataset includes both Base and Ethereum chains, features were aggregated across chains. Chain-specific identifiers (e.g., chain, chain_transfer, chain_dex) were removed during preprocessing to ensure model generalization.

3.6 Data Preprocessing

  • Deduplication: Duplicate addresses were handled by keeping the first occurrence.
  • Missing Values: Imputed using median values for numerical features to avoid bias.
  • Feature Scaling: Applied StandardScaler to normalize features for model training.
  • Feature Order Preservation: Ensured consistent feature order between training and testing using a saved xgb_feature_order.csv.

To prepare data for modeling:

  • Chain Identifiers Removed: Columns like chain, chain_transfer, and chain_dex were dropped to generalize the model across chains.
  • Missing Values: Filled with median values during test preparation to maintain robustness.
  • Key Features: Aggregated metrics (e.g., mean, sum, min, max) for transaction values, gas usage, timestamps, and DEX swap amounts were computed.

Feature importance analysis later revealed that temporal features (e.g., tx_lifetime_days) and transaction value metrics were critical predictors.

4: Model Training and Evaluation

The model was built using XGBoost, a gradient boosting framework suitable for imbalanced datasets.

4.1 Model Training

  • Initial training yielded a high validation AUC of 0.99841 at iteration 218, indicating strong discriminative power.

4.2 Initial Evaluation

  • Classification Report:
            precision    recall  f1-score   support
0.0         1.00      0.99      0.99     20562
1.0         0.83      0.97      0.90      1318
accuracy                        0.99     21880
macro avg   0.92      0.98      0.94     21880
weighted avg 0.99     0.99      0.99     21880
  • ROC AUC Score: 0.9984

The model excels at identifying Sybil wallets (recall 0.97) while maintaining high overall accuracy (0.99).

4.3 Model Evaluation

Further evaluation provided detailed metrics:

  • AUC: 0.9977
  • F1 Score: 0.8921
  • Precision: 0.8404
  • Recall: 0.9507
  • Top 10 Features:
Feature                     Importance
tx_lifetime_days            0.411957
VALUE_mean                  0.082130
VALUE_sum                   0.052093
BLOCK_TIMESTAMP_max         0.038899
dex_AMOUNT_OUT_USD_mean     0.035266
GAS_USED_mean               0.031219
BLOCK_TIMESTAMP_min         0.021890
GAS_PRICE_mean              0.018956
dex_BLOCK_TIMESTAMP_min     0.016806
received_CONTRACT_ADDRESS_nunique 0.014707

Temporal and value-based features dominate, highlighting their role in Sybil detection.

4.4 Hyperparameter Tuning

Hyperparameter tuning was conducted using a grid search (3-fold cross-validation, 30 candidates, 90 fits):

  • Best Parameters:
    • subsample: 1.0
    • min_child_weight: 1
    • max_depth: 7
    • learning_rate: 0.1
    • gamma: 0
    • colsample_bytree: 0.6
  • Best AUC (mean CV): 0.9978823572373976
  • Final Validation Metrics:
    • AUC: 0.9989
    • F1 Score: 0.9075
    • Precision: 0.8459
    • Recall: 0.9788

Tuning improved recall to 0.9788, crucial for minimizing missed Sybil wallets.

4.5 Confusion Matrix

  • Values:
    • True Negatives (TN): 20,327
    • False Positives (FP): 235
    • False Negatives (FN): 28
    • True Positives (TP): 1,290
  • Recall: 0.9788 (TP / (TP + FN))

The low FN count (28) underscores the model’s effectiveness at detecting Sybils.

5: Predictions on Test Addresses

  • Total Unique Test Addresses: 20,369 (after deduplication)
  • Process:
    • Features prepared similarly to training data.
    • Missing values filled with medians.
    • Predictions made using the tuned XGBoost model.
  • Threshold: 0.1 (lowered from 0.5 to increase recall).
  • Output: Saved to submission.csv.

Conclusion

The Sybil Detection model, implemented with XGBoost, achieves exceptional performance:

  • Final AUC: 0.9989
  • Recall: 0.9788
  • F1 Score: 0.9075

Key strengths include:

  • High recall (few Sybils missed), vital for Web3 security.
  • Robust feature engineering, leveraging temporal and value-based metrics.
  • Generalization across Base and Ethereum chains via chain identifier removal.

The model effectively mitigates Sybil attacks by identifying fraudulent wallets with high accuracy, supported by thorough data preprocessing and hyperparameter optimization.

  • This write up is for my fifth submission. I am going to improve my model and then again I will write a detail description about my model.
1 Like

Sybil Detection Model Report: GPU-Accelerated Multi-Chain Analysis

Author: Casuwyt Periay
Date: May 29th, 2025

1. Introduction

1.1. Problem Statement & Motivation

Sybil attacks pose a fundamental threat to decentralized systems in the Web3 ecosystem. These attacks involve malicious actors creating multiple fake identities (wallet addresses) to gain disproportionate influence, exploit airdrop distributions, manipulate governance decisions, or extract unfair rewards from protocol incentives. The detection of Sybil accounts is crucial for maintaining the integrity and fairness of blockchain networks. This project develops a machine learning solution to identify potential Sybil addresses based on their on-chain behavioral patterns across multiple blockchain networks.

1.2. Technical Approach

This analysis implements a GPU-accelerated machine learning pipeline leveraging RAPIDS (cuDF and cuPy) for efficient processing of large-scale blockchain data. The approach combines data from two major networks (Ethereum and Base) to create a comprehensive behavioral profile for each address, enabling robust Sybil detection across different blockchain ecosystems.

1.3. Methodology Overview

The project follows a systematic approach:

  • GPU-Accelerated Data Processing: Utilizing NVIDIA L4 GPU with RAPIDS for fast data loading and feature extraction
  • Multi-Chain Analysis: Combining behavioral data from Ethereum and Base networks
  • Comprehensive Feature Engineering: Creating 24 behavioral features capturing transaction, token, and DEX interaction patterns
  • Ensemble Modeling: Employing XGBoost and LightGBM with careful hyperparameter tuning
  • Robust Validation: Implementing proper train-test splitting and cross-validation strategies

2. Data Description and Preparation

2.1. Dataset Overview

The analysis utilized comprehensive blockchain data from two networks:

Ethereum Network:

  • Training addresses: 52,501 (with 2,516 Sybils)
  • Test addresses: 20,369
  • Transactions, token transfers, and DEX swap data

Base Network:

  • Training addresses: 51,515 (with 1,515 Sybils)
  • Test addresses: 20,369
  • Similar transaction and activity data

Combined Dataset:

  • Total training samples: 99,008 (after removing 59 potential false negatives)
  • Sybil rate: 2.57% (2,526 Sybils out of 99,008 addresses)
  • Class imbalance ratio: approximately 38:1 (Normal:Sybil)

2.2. Data Quality Enhancements

Several data quality measures were implemented:

  • Numeric Data Cleaning: Handling of infinite values and extreme outliers
  • Temporal Data Processing: Converting timestamps to Unix format for better model compatibility
  • Address Normalization: Converting all addresses to lowercase for consistency
  • False Negative Removal: Excluding 59 addresses identified as potential mislabeled samples

3. Feature Engineering

3.1. Feature Categories

The feature engineering process resulted in 24 carefully crafted features across five main categories:

1. Transaction Features (12 features)

  • Basic counts: tx_sent_count, tx_received_count, tx_total_count
  • Value statistics: tx_sent_value_sum, tx_sent_value_mean, tx_sent_value_std, tx_sent_value_max
  • Network metrics: unique_to_addresses
  • Temporal features: tx_first_timestamp_unix, tx_last_timestamp_unix, tx_days_active

2. Token Transfer Features (8 features)

  • Activity metrics: token_sent_count, token_received_count, token_total_count
  • Value analysis: token_sent_usd_sum, token_sent_usd_mean, token_sent_usd_max
  • Diversity metrics: unique_tokens_sent, unique_symbols_sent

3. DEX Interaction Features (4 features)

  • dex_swap_count
  • dex_volume_in_usd
  • dex_avg_swap_size_usd
  • unique_dex_platforms

3.2. Feature Importance Analysis

The most influential features identified by the models were:

Top 5 Features:

  1. tx_first_timestamp_unix (importance: 158.59) - Account creation time
  2. tx_last_timestamp_unix (importance: 124.52) - Recent activity indicator
  3. unique_to_addresses (importance: 69.05) - Network interaction breadth
  4. tx_sent_value_max (importance: 67.51) - Maximum transaction value
  5. tx_sent_value_sum (importance: 66.03) - Total value transferred

4. Model Development and Results

4.1. Model Architecture

Two gradient boosting models were employed:

XGBoost Configuration:

  • GPU acceleration enabled
  • 125 boosting rounds
  • Custom objective for binary classification
  • Scale position weight: 38.2 (to handle class imbalance)

LightGBM Configuration:

  • GPU training with OpenCL
  • Early stopping after 73 iterations
  • Binary objective with class weight balancing
  • Feature histogram optimization with 256 bins

4.2. Performance Metrics

The models achieved strong performance in identifying Sybil addresses:

Training Performance:

  • XGBoost Validation AUC: 0.9965
  • LightGBM Validation AUC: 0.9960

Test Set Predictions:

  • Total test addresses: 20,369
  • Predicted Sybils (>0.9 probability): 103 (0.51%)
  • High-risk addresses (>0.8 probability): 326 (1.60%)
  • Low-risk addresses (<0.2 probability): 14,734 (72.33%)

4.3. Prediction Distribution Analysis

The model produced well-separated predictions:

  • Mean prediction score: 0.163
  • Median prediction score: 0.050
  • Standard deviation: 0.226
  • Skewness: 1.568 (indicating right-skewed distribution)
  • Kurtosis: 1.400 (moderate peakedness)

5. Key Findings and Insights

5.1. Behavioral Patterns of Sybil Accounts

  1. Temporal Characteristics: Sybil accounts show distinct temporal patterns, with account age and activity timing being the most predictive features
  2. Transaction Behavior: Sybils tend to have:
  • Higher transaction volumes and values
  • More diverse interaction patterns (unique addresses)
  • Larger maximum transaction values
  1. Network Effects: The breadth of network interactions (unique addresses contacted) is a strong indicator of Sybil behavior

5.2. Feature Category Importance

Analysis of feature categories revealed:

  • Transaction features: 40.4% of total importance
  • Value-based features: 22.8% of total importance
  • Time-based features: 16.1% of total importance
  • Token features: 14.3% of total importance
  • DEX features: 6.3% of total importance

6. Technical Implementation Details

6.1. GPU Acceleration Benefits

  • Hardware: NVIDIA L4 GPU
  • Memory efficiency: Maintained under 2.1GB CPU memory usage
  • Processing speed: Feature extraction completed in 0.08 minutes
  • Scalability: Successfully processed over 100k addresses with millions of associated transactions

6.2. Model Optimization Strategies

  1. Class Imbalance Handling: Used scale_pos_weight parameter (38.2) to properly weight minority class
  2. Feature Scaling: Standardized features using scikit-learn’s StandardScaler
  3. Outlier Management: Implemented quantile-based clipping for extreme values
  4. Missing Value Strategy: Filled NaN values with 0 after careful analysis

7. Conclusions and Recommendations

7.1. Model Performance Summary

The developed Sybil detection system demonstrates strong performance with:

  • High discriminative power (AUC > 0.996)
  • Effective identification of high-risk addresses
  • Well-calibrated probability outputs
  • Efficient GPU-accelerated processing

7.2. Practical Applications

The model can be deployed for:

  1. Airdrop Protection: Screening addresses before token distributions
  2. Governance Security: Identifying potential Sybil voters
  3. Risk Assessment: Continuous monitoring of network participants
  4. Cross-chain Analysis: Detecting Sybils operating across multiple networks

7.3. Future Improvements

Potential enhancements include:

  1. Graph-based Features: Incorporating network topology analysis
  2. Behavioral Sequences: Analyzing temporal patterns of actions
  3. Cross-chain Correlation: Linking addresses across more networks
  4. Real-time Detection: Implementing streaming analysis capabilities

7.4. Limitations and Considerations

  1. Label Quality: Model performance depends on the accuracy of training labels
  2. Temporal Bias: Features may be less effective for newly created addresses
  3. Adversarial Adaptation: Sybil operators may modify behavior to evade detection
  4. False Positive Impact: ~27.7% of addresses have probabilities between 0.1-1.0, requiring careful threshold selection

8. Final Remarks

This GPU-accelerated Sybil detection system successfully identifies suspicious addresses with high accuracy while maintaining computational efficiency. The combination of comprehensive feature engineering, robust model selection, and careful validation produces a practical solution for enhancing security in decentralized systems. The model’s strong performance, particularly in identifying temporal and transactional patterns, provides a solid foundation for protecting blockchain ecosystems from Sybil attacks.

Sybil Detection Model - Technical Writeup

Executive Summary

This project implements an advanced machine learning pipeline for detecting Sybil attacks in blockchain networks, specifically targeting Ethereum and Base networks. Sybil attacks involve creating multiple fake identities to manipulate decentralized systems, making their detection crucial for maintaining network integrity and security.

Problem Statement

Sybil detection in blockchain networks presents unique challenges:

  • Scale: Processing millions of transactions across multiple networks
  • Imbalanced Data: Sybil addresses typically represent a small fraction of total addresses
  • Feature Engineering: Extracting meaningful patterns from blockchain transaction data
  • Cross-Network Analysis: Handling data from multiple blockchain networks (Ethereum and Base)

Solution Architecture

Core Components

  1. Data Loading Module: Robust data ingestion system handling multiple blockchain networks
  2. Feature Engineering Pipeline: Comprehensive feature extraction from transaction patterns
  3. Model Ensemble: Multiple machine learning algorithms for improved detection accuracy
  4. Cross-Validation Framework: Rigorous model evaluation and validation

Key Features

1. Robust Data Handling

  • Multi-Network Support: Processes both Ethereum and Base blockchain data
  • Error Resilience: Graceful handling of missing or corrupted data files
  • Dynamic Column Detection: Automatically identifies address and label columns
  • Data Consolidation: Combines datasets from multiple sources while removing duplicates

2. Advanced Feature Engineering

The model extracts several categories of features:

Transaction Volume Features:

  • Transaction count (sent + received)
  • Unique counterpart addresses
  • Total value sent/received
  • Average transaction values
  • Maximum transaction values
  • Value standard deviation

Behavioral Pattern Features:

  • Sent-to-received value ratio
  • Unique counterpart ratio (diversity of interactions)
  • Transaction frequency patterns

Temporal Features:

  • Days active on network
  • First transaction timestamp
  • Transaction frequency over time
  • Activity pattern analysis

3. Ensemble Learning Approach

The model employs three complementary algorithms:

Random Forest Classifier:

  • Handles non-linear relationships
  • Built-in feature importance ranking
  • Robust to outliers
  • Configuration: 200 estimators, max depth 8, balanced class weights

XGBoost Classifier:

  • Gradient boosting for complex pattern detection
  • Advanced regularization techniques
  • Optimized for imbalanced datasets
  • Configuration: 200 estimators, learning rate 0.05, scale_pos_weight adjustment

Logistic Regression:

  • Interpretable linear relationships
  • Regularized to prevent overfitting
  • Scaled features for optimal performance
  • Configuration: L2 regularization, balanced class weights

Technical Implementation

Data Pipeline

Raw Data → Data Loading → Feature Engineering → Model Training → Ensemble Prediction
  1. Data Loading:
  • Loads parquet files for transactions, token transfers, and DEX swaps
  • Handles missing files gracefully
  • Combines multi-network data
  1. Feature Engineering:
  • Transaction pattern analysis
  • Temporal behavior extraction
  • Outlier detection and capping
  • Missing value imputation
  1. Model Training:
  • Stratified cross-validation
  • Class imbalance handling
  • Hyperparameter optimization
  • Ensemble weight optimization

Key Algorithmic Innovations

1. Outlier Handling

  • Value Capping: Clips extreme transaction values at 99th percentile
  • Statistical Bounds: Removes values beyond 3 standard deviations
  • Robust Scaling: Uses RobustScaler for feature normalization

2. Imbalanced Data Handling

  • Class Weighting: Automatically balances class weights in all models
  • Scale Pos Weight: XGBoost parameter tuned for class imbalance
  • Stratified Sampling: Maintains class distribution in cross-validation

3. Feature Selection Strategy

  • Domain Knowledge: Focus on transaction patterns known to indicate Sybil behavior
  • Correlation Analysis: Removes highly correlated features
  • Stability Checking: Ensures features are robust across different data splits

Performance Evaluation

Validation Strategy

  • 3-Fold Stratified Cross-Validation: Maintains class distribution across folds
  • ROC-AUC Scoring: Appropriate metric for imbalanced binary classification
  • Individual Model Assessment: Evaluates each algorithm’s contribution

Model Interpretability

  • Feature Importance: Random Forest provides natural feature ranking
  • Coefficient Analysis: Logistic Regression offers interpretable linear relationships
  • Ensemble Weights: Equal weighting strategy for model combination

Results and Insights

Model Performance

The ensemble approach provides several advantages:

  • Improved Robustness: Multiple algorithms reduce single-model bias
  • Better Generalization: Ensemble typically outperforms individual models
  • Risk Mitigation: Failures in individual models don’t compromise entire system

Feature Insights

Key discriminative features for Sybil detection:

  • Transaction Frequency: Automated Sybil accounts often show unusual activity patterns
  • Value Ratios: Sybil accounts typically have distinctive sent/received ratios
  • Counterpart Diversity: Legitimate users interact with more diverse addresses
  • Temporal Patterns: Sybil accounts often show batch-like activity patterns

Production Considerations

Scalability

  • Memory Management: Efficient data processing with garbage collection
  • Parallel Processing: Multi-core utilization for model training
  • Chunked Processing: Can handle large datasets through batch processing

Robustness

  • Error Handling: Comprehensive exception handling throughout pipeline
  • Data Validation: Automatic detection of data quality issues
  • Fallback Mechanisms: Graceful degradation when components fail

Monitoring

  • Performance Tracking: Cross-validation scores for model health monitoring
  • Data Drift Detection: Feature distribution monitoring capabilities
  • Prediction Quality: Output validation and sanity checking

Future Enhancements

Technical Improvements

  1. Advanced Feature Engineering: Graph-based features using network topology
  2. Deep Learning Integration: Neural networks for complex pattern recognition
  3. Real-time Processing: Streaming architecture for live detection
  4. Multi-chain Expansion: Support for additional blockchain networks

Operational Improvements

  1. Automated Retraining: Continuous learning from new labeled data
  2. A/B Testing Framework: Compare model versions in production
  3. Explainability Tools: Enhanced interpretability for compliance requirements
  4. API Integration: RESTful API for real-time prediction serving

Conclusion

This Sybil detection model represents a comprehensive approach to blockchain fraud detection, combining domain expertise with advanced machine learning techniques. The ensemble methodology provides robust performance while maintaining interpretability, making it suitable for production deployment in high-stakes blockchain security applications.

The modular architecture allows for easy extension and modification, while the robust error handling ensures reliability in production environments. The focus on feature engineering from domain knowledge provides a strong foundation for accurate Sybil detection across multiple blockchain networks.


This writeup provides a technical overview of the implementation. For specific deployment instructions or detailed algorithm parameters, please refer to the source code documentation.